
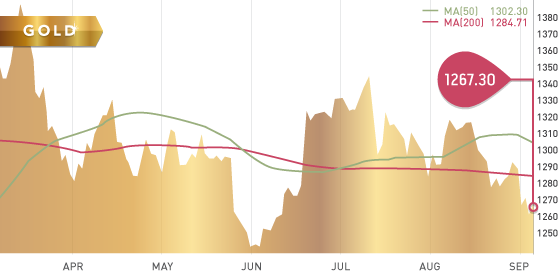
Gold was under pressure this week from a rising US dollar and closed down ~2% at $1267.30. An improving US economy and struggling Eurozone means continued appreciation for the US dollar. The Euro hit a 14 month low this week after the ECB announced a cut in interest rates and the embarking of a quantitative easing program.
Gold did have a small move upwards on Friday (+$7.50) as the US payrolls number disappointed. The move was less than expected as investors also factored in the word of a possible cease fire between Russia and Ukraine.
Technicals:
- Support: $1,250
- Resistance: $1,290
- 50 day moving average: $1,307.30
- 200 day moving average: $1,284.71
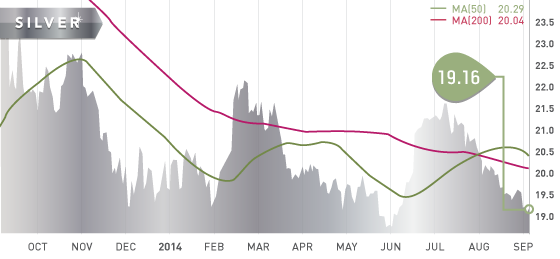
Silver
Silver closed at $19.16 per ounce.
Technicals:
- Support: $19
- Resistance: $19.56
- 50 day moving average: $20.29
- 200 day moving average: $20.04
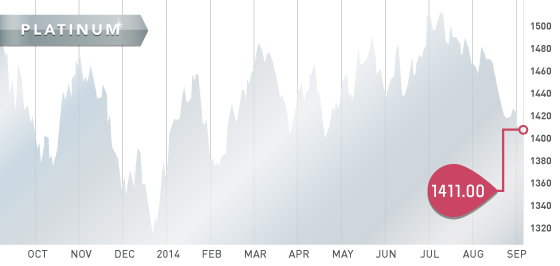
Platinum
Platinum closed the week at $1,411 per ounce, down $13 on the week. Looking at the charts, platinum could potentially be putting in a triple bottom at the $1.400 level. The price is down almost $100 since the end of July as weak economic data out of Europe weighs on the price.
Technicals:
- Support: $1,400
- Resistance: $1,431.30
- 50 day moving average: $1,467.07
- 200 day moving average: $1,434.84

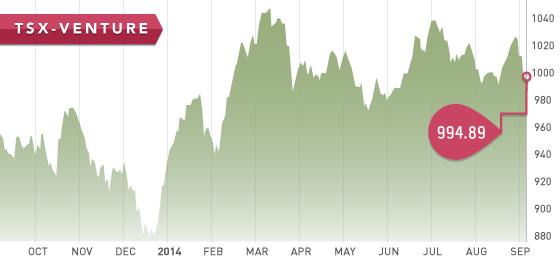
It was a rocky start for the TSX Venture in the first trading week of September. All four trading days were in the red. Commodity prices were down sharply, and this helped factor into the decline. The Venture is back to early April levels and we expect it to head lower before year’s end.
A Look Ahead
The key items on the calendar this week are:
- September 8 Monday – Consumer Credit
- September 11 Thursday – Employment Claims
- September 11 Thursday – Treasury Budget
- September 12 Friday – Retail Sales

The Tickerscores Top 10 Resource Stocks for the Autumn has hit your inbox!
Please let us know of any feedback you have as we would love to hear from readers: info@tickerscores.com
Quebec exploration companies are being scored off of 2nd quarter financials. A sneak preview: Balmoral (BAR.T) is the top score, but are they current overvalued with a 280% return so far in 2014?

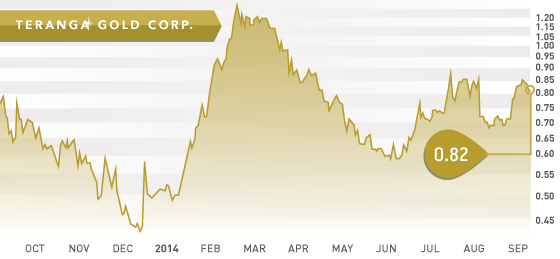
- Symbol: TGZ.T
- Price: $0.82
- Shares Outstanding: 352.8 million
- Market Cap:$289.3 million
- Cash: $28,381,000 ($15 million restricted)
This week we take a look at Teranga Gold, a producer in Senegal, West Africa. Teranga management has forecasted a strong second half of the year with higher production and lower costs. All-in sustaining cash costs are very good coming in at $1,060 per ounce in the second quarter. All operations are low cost and long-life which provides a solid foundation for the future.
TGZ is attractive investment as they offer growth potential in reserves, production, and free cash flow. Management expects to generate significant free cash flow in 2015 and moving forward. At the end of 2013, Teranga completed a $135 million streaming deal with Franco Nevada (FNV.T). This is important for investors because it means Franco has done significant due diligence on the assets of Teranga.
Alan Hill (Chairman) has been purchasing shares in the open market in the last couple weeks of August, and this is always a good sign:
Aug 22 – 17,000 * $0.73 = $12,410
Aug 20 – 500,000 *$0.72 = $360,000
Aug 15 – 19,000 *$0.72 = $13,680
Bottom line: Teranga is a gold producer that is profitable down to $1,050 gold and has the upside potential to double. There’s no rush to buy the stock, but on any pullback this could be a name to tuck away for the long run.
Catalysts:
- Third quarter results (look for net income)
- Integration of OJVG – Marata mining expected (September)
- Reserve development drilling
- Gora development 65,000 oz annual production (expected mid 2015)
AUG


