
Gold
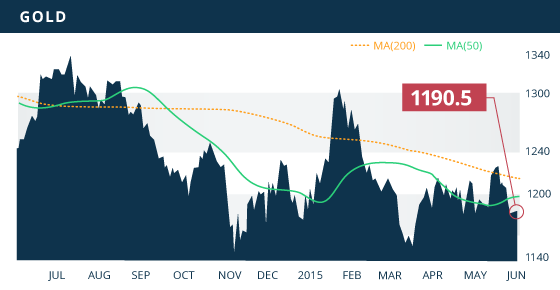
Gold was under pressure once again last week as U.S. data is showing signs of improving over the weak first quarter. Following the good data across the board on Tuesday, the metal dropped $10 to the $1,186 level, and the market spent the rest of the week undecided on the next direction. After a 1.44% sell-off the preceding week, gold ended the week down another 1.24% to close at $1,190.50 an ounce.
Gold continues to trade within a 2-month consolidation zone between the $1,180-$1,225 range, with the metal persistently finding buyers around the $1,180 area. Support remains at the $1,175 level, with solid resistance around the $1,232 area. The 50% retracement of the January high to March low comes in at $1,225, so this area will need to be ploughed through in order for the market to be convinced of any serious uptrend in the gold price. This level was overcome in mid-March, however that test failed and the price has declined close to 4% since then. Therefore, we will need to see a clear breakout above $1,230 in order to be convinced of a new extended rally in the gold price.
Technicals:
- Support: $1,176.71
- Resistance: $1,232.30
- 50 day moving average: $1,196.89
- 200 day moving average: $1,215.44
- HUI/Gold Ratio: 0.140 (Last week 0.142)
Silver
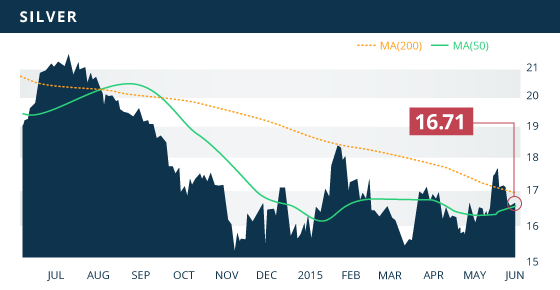
Silver was also under pressure again last week, falling another $0.39 to close the week at $16.71, down 2.3% on the week. The metal broke back below the descending 200 day MA, displaying the lack of strength behind the metal. Silver dropped below the $17 mark, yet the $16.85 support level did not hold. With the weakness displayed, we now look for support around the $16.45 area, which if broken will clearly show the silver bears are in control. Resistance comes in around the $17.30 area, with the $17.15 level providing additional pressure. A move up past these levels would be a good sign that buyers have re-emerged to take advantage of the pull-back.
Technicals:
- Support: $16.45
- Resistance: $17.32
- 50 day moving average: $16.60
- 200 day moving average: $16.97
- Gold/Silver Ratio: 71.24
- XAU/Gold Ratio: 0.0585 (Last Week: 0.0591)
Platinum
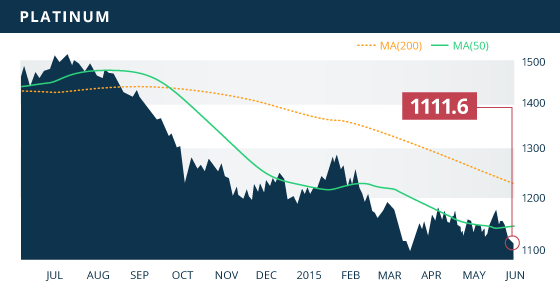
Platinum blew through support levels last week ending at $1,111.60, down $35.90 or 3.13% on the week. Sellers are clearly in control of the metal and are pushing the price back down towards the $1,100 level. The lack of support in the price displays that the metal is likely on route to retest the $1,086 level, a multi-year low established in mid-March. Resistance drops to the $1,130 level, an area reinforced by a broken trend line from the July highs, as well as the 23.6% retracement mark of the January high to the mid-March low. The picture is looking awfully bearish for the platinum price.
Technicals:
- Support: $1,086.50
- Resistance: $1,129.40
- 50 day moving average: $1,146.87
- 200 day moving average: $1,228.74

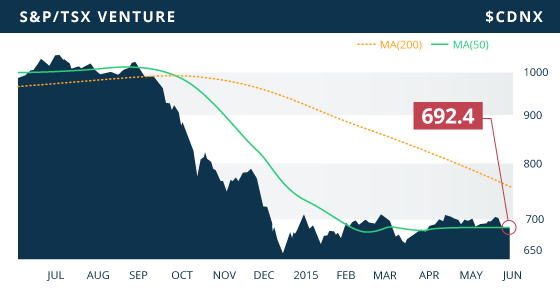
The TSX and the TSX-VENTURE were both down on the week 1.23% and 1.57% respectively. The VENTURE dropped back below the 700 mark to close the week at 692.4, down 11.03 points. This was a result of the mining sector dropping 1.73% and the energy sector shedding 1.96% on the week. Gold miners were down 0.6%, while the base metal sector was hit the hardest, plunging 2.5% as a result of copper collapsing to a 5-week low.
A Look Ahead
As we keep an eye on economies around the world, particularly on the recovery of the US, the condition of the Euro Area, and the growth in China, the key economic items on the calendar this upcoming week are:
Monday June 1
- HSBC Manufacturing PMI-May (CHN) – Consensus: 49.2
- German Manufacturing PMI-May (EA) – Consensus: 51.4
- Core PCE Index YoY (US) – Consensus: 1.3%
- ISM Manufacturing PMI-May (US) – Consensus: 52.0
Tuesday June 2
- Interest Rate Decision (AUS) – Consensus: 2.00%
- CPI YoY (EA) – Consensus: 0.2%
Wednesday June 3
- ADP Employment Change (US) – Consensus: 200K
- Trade Balance (US) – Consensus: (-$44B)
- ISM Non-Manufacturing PMI-May (US) – Consensus: 57.0
Thursday June 4
- Initial Jobless Claims (US) – Consensus: 279K
Friday June 5
- Nonfarm Payrolls (US) – Consensus: 225K
- Employment Change (CAN) – Consensus: 10K
The labour market data will be the most dominant features this week, especially with the market looking for continued strength coming out of the first quarter. The gold price will be very sensitive to any strength or weakness displayed in the jobs numbers that are out on Wednesday and Friday.

With the various circumstances now resolved, we are back to normal at Tickerscores and will be releasing a stream of updates starting this week. We will have Quebec/Atlantic Canada Developers out first, followed by Nevada and Mexico Producers. We also continue to work away at the TOP10 report which we anticipate to be out by the end of the month.


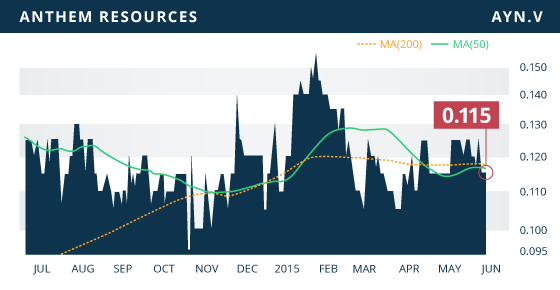
- Symbol: AYN.V
- Price: $0.115
- Shares Outstanding: 35,419,731
- Market Cap: $4.07 Million
- Cash: $14 million (Post-merger)
- Significant Shareholders: Management & Board (29.5%), Sprott Resource Corp. (26.7%), Energy Fuels Inc. (26.7%), Cormark Securities (15.8%)
Note: Anthem resources and Boss Power Inc. are not companies covered in the Tickerscores model. We have chosen Anthem as “stock of the week” because of the merger scenario with Boss Power. Therefore, we are essentially choosing the “merged company” as stock of the week.
Anthem Resources (TSX.V:AYN) is a Canadian-based junior mineral exploration company holding multiple uranium projects in Canada, as well as a 64.8% interest in Boss Power Corp. (TSX.V:BPU). Boss Power has recently emerged from a $30 million settlement with the province of British Columbia in relation to the expropriation of their Blizzard Uranium Project in 2008. In conjunction with the settlement, Boss Power completed a divisive reorganization which left the company with just over 42 million shares (27,250,000 held by Anthem), as well as $13.2 million of the $30 million settlement. The remainder of the $30 million was distributed to the other segregated entities of the divisive reorganization. At the beginning of May, Boss Power and Anthem announced an agreement to merge companies. Under the terms of the agreement, the 27,250,000 Boss shares that Anthem holds will be terminated, and Anthem shareholders will receive 0.75 of a Boss share for every Anthem share held. Following the merger, Boss Power will have 41,591,429 shares outstanding with Anthem shareholders holding 64.3% of the shares. The merged company will have over $13 million in cash, as well as a number of uranium projects and the Bell Mountain Gold Project in Nevada. Of the 4 uranium projects currently held by Anthem, two of them are joint ventures, one with Denison Mines (TSX:DML) and the other with Mega Uranium (TSX:MGA).
Boss recently completed a transaction for the right to acquire a 100% interest in the Bell Mountain Project, after Lincoln Mining (TSXV:LMG) lost the option due to non-payment, although they had spent $3 million towards the earn-in ($1.4 on exploration). Interestingly, Ron Netolitzky CEO of Boss Power and Director of Anthem, owns 50% of Lincoln Mining. So perhaps it is no coincidence that Bell Mountain eventually made its way into the hands of Boss Power. The Bell Mountain Gold Project is a 1,408 hectare low-grade gold property located in Nevada. The project database includes 227 drill holes for over 35,000 feet of drilling. The project contains a measured and indicated resource of 9.7 million tonnes grading 0.526 g/t of gold and 17.63 g/t of silver for 165,018 ounces and 5.5 million ounces respectively. There is an additional 29,550 ounces of gold and 872,411 ounces of silver in the inferred category. With over $13 million in cash, Boss should have no problems earning a 100% interest in the property, as well as continue to develop the project with further exploration, drilling, and possible economic studies.
Prior to the divisive reorganization, the board of Boss Power stepped down to make way for a new board to be formed of experienced mining professionals with strong technical experience. This new board includes Ross McElroy and Dev Randhawa, the COO and CEO/Chairman of Fission Uranium respectively, as well as Tom MacNeill, Donald Siemens, and Ron Stewart (former VP of Exploration for Kinross). In addition, Boss has been Chaired by Ron Netolitzky, whom is now the acting CEO. As mentioned above, Mr. Netolitzky also serves on the board of Anthem. Mr. Netolitzky is a prominent figure in the mining scene with 40 years of experience including being voted as the PDAC Prospector of the Year in 1991. He was also involved in the development of the Snip and Eskay Creek gold mines in BC, as well as the Brewery Creek heap-leach gold mine in the Yukon.
Anthem and Boss are being mentioned today because of their strong cash position ($13 million) compared to market cap ($7 million), low share count, and experience of their combined management teams. We feel there is a slight discrepancy between the share price of Boss Power and the share price of Anthem on a (0.75 share exchange rate) basis. Considering the share exchange, Anthem should be trading closer to $0.13 if Boss is trading at $0.17, so that relationship could be monitored for potential arbitrage-like situations. However, there are only 1.3% of Anthem shares held by retail, which does not leave much available shares to purchase. The remaining 98.7% of the Anthem shares are held by the four significant shareholders mentioned above. Boss Power does not have this issue, and therefore may provide a better opportunity to take a position.
Bottom line
With the developments over the past two years with the two companies, there is clearly a plan in place, and we now appear to be at the tail end of this restructuring. The settlement with the BC government has been finalized after years of litigation, and the company has been reorganized into a separate entity void of dissident shareholders. New personnel have been brought in at the board level, and new properties are being added to the portfolio. Investors interested in this story can look at either Boss or Anthem, although there are some things to consider with the two companies as mentioned earlier. Due to the fact these two companies are so thinly traded, investors would need to be patient and selective with their bids, particularly with Anthem. With the company in a strong financial position with $13 million and no debt, and trading at a post-merger market cap of $7 million, there is clearly a discrepancy in the share price and cash position; and this is without considering the project portfolio of the combined companies. The $13 million in cash positions this company well to develop their properties and avoid share dilutive financings during this current depressed market. With a plan clearly being unfolded, and the company trading at a near 50% discount to cash while giving no value to their project portfolio, we believe there is little downside risk at this level.
Potential Catalysts and Events to Monitor:
- Completion of Merger
- Property Acquisitions
- Bell Mountain Development
JUN


