
Gold
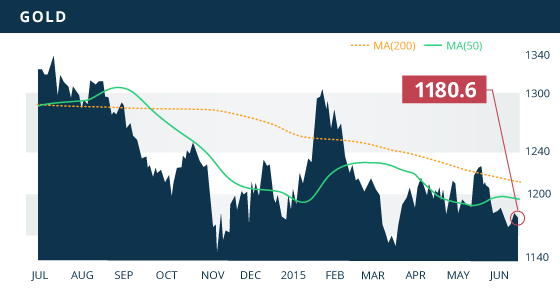
Gold rebounded mildly on the week to close at $1,180.60, up $8.80 or 0.75%. With the struggling U.S. dollar this week we should have seen a stronger push by gold, yet the fact that we did not is an indication of the lack of conviction for the metal. Perhaps the market is waiting to see the outcome of the FOMC meeting next week, as it will be an important event to monitor with typically volatile implications for the gold price.
Although breached slightly over the past two weeks, the $1,175 area continues to provides near-term support, with the $1,162 level of the June 5th sell-off providing solid support; buyers emerged with force at that level. Resistance continues to be at the $1,197 area, yet a significant break above this mark and the $1,205 level would be a positive move for the metal and one indicating a potential re-test of the $1,225 area. Watch for breaks of the support or resistance levels on Wednesday when the FOMC statement is released.
The HUI/Gold ratio has hit a 6-month low with gold miners down another 3% this week, despite the gold price gaining 0.75% on the week. Gold miners are now down close to 10% over the past 4 weeks. A positive move by gold this week should have buyers coming in to take advantage of these depressed miners.
Technicals:
- Support: $1,162.65
- Resistance: $1,197.50
- 50 day moving average: $1,195.08
- 200 day moving average: $1,209.81
- HUI/Gold Ratio: 0.132 (Last week 0.136)
Silver
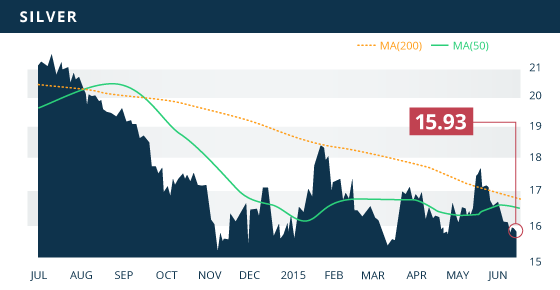
Silver fell for the fourth consecutive week to close at $15.93, down another 1%. The XAU/Gold ratio fell to a 3-month low this week, however the losses of the XAU are less then those of the HUI, indicating the silver miners are not getting sold off in the same degree as the gold miners.
Near-term support is at the $15.80 level, an area that the metal found support in early-May as well as late this week. Silver breached an ascending trend line from the mid-March low both on Thursday and again on Friday, however the metal rebounded to close above the trend line on both occasions. As mentioned last week, a clear break below this trend line would have the metal looking towards solid support, which will be found at the $15.05 area. Near-term resistance continues to be around the $16.64 area with solid resistance at the $16.85 level.
Technicals:
- Support: $15.80
- Resistance: $16.85
- 50 day moving average: $16.48
- 200 day moving average: $16.81
- Gold/Silver Ratio: 74.11
- XAU/Gold Ratio: 0.0564 (Last Week: 0.0578)
Platinum
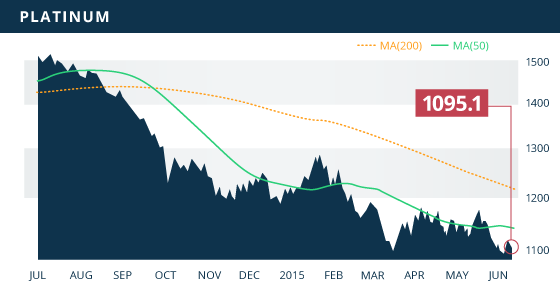
Platinum had a mini rally to start the week but was overwhelmed to the downside Thursday and Friday. The metal closed the weekly session at $1,095.10, although down only slightly. Support continues to be at the multi-year low of $1,086, although as mentioned last week, any break of $1,086 will likely put the $1000 mark in the crosshairs of sellers. The $1,122 resistance level held up last week as the metal could not overcome the $1,120 level, and was eventually sold back down below $1,100. Perhaps this is an area to monitor as a potential consolidation zone between $1,086 and $1,120.
Technicals:
- Support: $1,086.50
- Resistance: $1,121.80
- 50 day moving average: $1,132.52
- 200 day moving average: $1,212.02

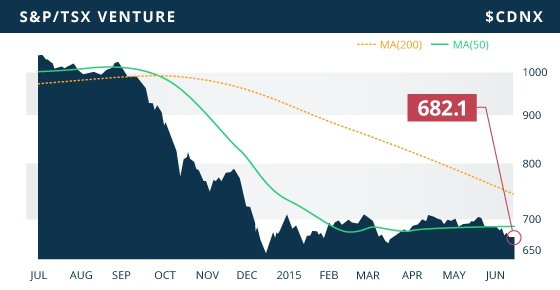
For the third consecutive week the TSX and the TSX-VENTURE were both down, 1.44% and 1.12% respectively. The VENTURE hit a 2.5-month low this week closing at 682.14, down over 7 points. Resources were down across the board with the mining sector suffering a 1.76% decline, and the energy sector dropping 2.2% on the week. Gold miners were again hit the hardest, dropping a further 3.24% and compounding on the 3.62% decline of the prior week. The base metal sector dropped 1.49% to its lowest level since mid-March, as copper plummeted on Thursday to re-test the $2.65 level. After breaking through a 4-month trend line last week copper is looking particularly weak.
A Look Ahead
As we keep an eye on economies around the world, particularly on the recovery of the US, the condition of the Euro Area, and the growth in China, the key economic items on the calendar this upcoming week are:
Monday June 15
- NY Empire State Manufacturing (US) – Consensus: 6.00
- Industrial Production (US) – Consensus: 0.3%
Tuesday June 16
- German Economic Sentiment (EA) – Consensus: 37.1
- Building Permits May (US) – Consensus: 1.1M
- Housing Starts May (US) – Consensus: 1.1M
Wednesday June 17
- CPI YoY (EA) – Consensus: 0.3%
- FOMC Meeting (US)
- Fed Interest Rate Decision (US) – Consensus: 0.25%
Thursday June 18
- Core CPI MoM (US) – Consensus: 0.2%
- Initial Jobless Claims (US) – Consensus: 275K
- Philly Fed Manufacturing Index (US) – Consensus: 8.0
Friday June 19
- Core CPI MoM (CAN) – Consensus: 0.3%
The main item to watch for this week will be the two-day FOMC meeting that concludes on Wednesday. There is unlikely to be a rate-hike during this meeting, with the market placing a 7% chance of a hike. However, Yellen will issue a statement followed by a question period. This is where some clues can be obtained. Any concerns or hesitations about a hike in September will be seen as positive for gold. The data out on Monday and Tuesday could be somewhat influential to Fed members during the meeting, especially the housing numbers which saw a strong performance during the month of April.

We have multiple updates about to come through for subscribers in the next week or two. Thank you for your patience.

![]()
- Symbol: GXS.V
- Price: $0.17
- Shares Outstanding: 126,517,723
- Market Cap: $21.5 Million
- Cash: $5.6 Million (As of March 31st)
- Significant Shareholders: Management and Directors (16%), Donald Smith Value Fund (16%), IAMGOLD (5% indirectly)
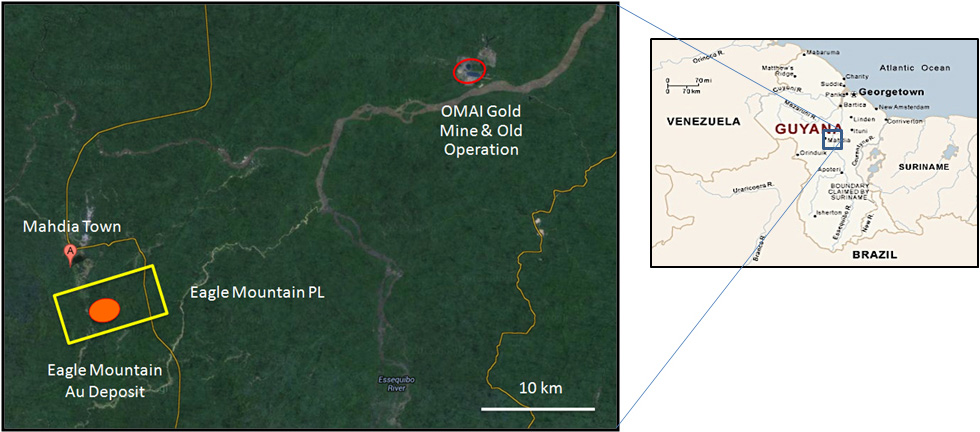
Goldsource Mines Inc. (TSX.V:GXS) is a Canadian-based junior resource company that is developing their 100%-owned Eagle Mountain Gold Project in Guyana. The company is fully financed for Phase I construction which commenced in March and is currently on time and on budget, with commissioning expected for Q4 of 2015. The management team behind Goldsource is the same team behind Silvercrest Mines (SVL.TO), a company that they have built into a respectable silver producer with a market cap of $150 million while producing close to 3 million silver equivalent ounces in 2014 and aiming to produce 4 million in 2015. The company used the same approach with Silvercrest’s Santa Elena mine as they are planning with the Eagle Mountain; by starting small and expanding operations with the cash flow generated from the project.
The Eagle Mountain Gold Project contains a hard rock deposit overlain by a gold mineralized saprolite deposit. Saprolite is a soft, chemically weathered material of the underlying bedrock surface. The mineralized saprolite material at Eagle Mountain contains an average diluted (10%) and recoverable grade of 1.20 g/t of gold. This material is easily moved by machinery with no blasting or haul trucks required. This characteristic generates lower cost operations and improved economics.
The economics of Eagle Mountain displayed in the 2014 PEA are quite robust. Using a $1250 gold price, the project has an (after-tax) NPV7% of $40 million, with an IRR of 63% over an 8-year mine life. It is worth noting that a 2% NSR held by Kilroy Mining Inc. was not included in the PEA. This 2% NSR would scalp approximately $4 million off of the life of mine revenue. It should also be noted that the PEA is based on inferred ounces (78%) which represent 76% of the gold, and the company has moved forward with construction without a feasibility study completed on the project. As the company states: “The Company cautions that the decision to proceed to production is based on a PEA and not on a feasibility study of mineral reserves demonstrating economic and technical viability and accordingly, there are increased uncertainties and added economic and technical risks associated with this production decision. The PEA is preliminary in nature in that it is based largely on inferred mineral resources which are considered too speculative geologically to have the economic considerations applied to them that would enable them to be characterized as mineral reserves, and there is no certainty that the PEA will be realized.”
However, with saprolite deposits being fairly simple in terms of mining, and with an ultimate depth of 40 meters in the case of Eagle Mountain with simple processing (gravity), there should be little surprises. The main factors will be dilution control during mining and positive recoveries from the gravity concentrators during processing (ie. 60% or more). In the PEA the metallurgical studies showed that the undersized material (-2mm) from screening represents 85% of feed material. This undersized material contains 90% of the gold of the saprolite resource. In the proposed mine plan, Goldsource will screen the material using a 2mm screen size which will have undersized material pass through and fed into a gravity concentrator, while the remaining oversized feed (15%) will be stockpiled for potential processing in the future. Based on the preliminary metallurgical test work completed on the project, the PEA was based on recoveries of 60% using gravity concentration alone. There is potential to improve on this 60% recovery with mill optimization and additions, possibly to as high as 82%.
Tailings from the gravity concentrators will be collected and retained in settling ponds for potential future processing. With additional grinding and processing, these tailings could provide a further 60,000 ounces based on the 82% recoveries achieved in the met tests, using a combination of milling, gravity, and floatation. These ounces are not included in the PEA. Additionally, the oversized material (+2mm) that is screened, will be stockpiled for potential future processing. This material contains an additional 40K-50K ounces. Essentially, the company could upgrade their mill using the initial cash flow generated from processing the undersized material, and unlock these additional 100,000 plus ounces. This could possibly grow the revenue of the project by over 50%. There are also other saprolite mineralization on the property that could potentially provide future mill feed and add additional ounces to the revenue stream.
This mill upgrade/expansion could also be completed to handle the ore from the potential mining of the underlying hard rock deposit. This hard rock resource contains 600,000 indicated and inferred ounces grading 1.2 g/t of gold. By mining the overlying mineralized saprolite material, the company is essentially pre-stripping these hard rock deposits. This prepares these deposits for mining should the company upgrade/expand their mill to process the hard rock ore. This is a future component that could become a value generator for shareholders.
Last year Goldsource amended the property agreement and deferred approximately $8 million in payments associated with the Eagle Mountain property agreement. These payments were to be initially triggered upon granting of a mining licence by the Guyana Geology and Mines Commission (GGMC), and secondly, the subsequent achievement of commercial production. Goldsource has now pushed those payments into the future, most likely into 2018-2019 when the company has reached the 50,000 ounce production milestone.
There is a considerable warrant overhang to be aware of with Goldsource. There are currently 50.2 million warrants outstanding, with 23.5 million of those related to the project financing completed in December. Of those 23.5 million warrants, 7.7 million are held by directors of the Goldsource that participated in the project funding. A total of 9.5 million are held by directors of the company, with another 10 million held by Donald Smith Value Fund, a 16% share holder as mentioned above. If all warrants were exercised, it would generate around $12.5 million for the company, but also dilute the share count by 40%. There are 6.5 million warrants that expire in August that likely wont get exercised.
Due to the lack of definitive metallurgical studies, and the fact that the PEA is preliminary in nature while being based 78% on inferred resources, we feel that we should take a conservative look at this project to try to identify downside risk. We used a conservative gravity recovery of 50% instead of the 60% used in the PEA economics. Therefore using the current gold price of around $1,200, and considering the 2% NSR to Kilroy, as well as the $8 million due upon production targets, our conservative base case estimate of the after-tax free cash flow that would be generated from the project would be closer to $10 million ($0.08/share) instead of $40 million. However keep in mind this is at 50% recoveries instead of the modeled 60%. It also excludes any of the upside potential possible from additional processing of oversize material and tailings (ie, 100K ounces), or the potential discovery of additional saprolite deposits, or the possible exploitation of the 600K ounce hard rock resource. As we mentioned, there is the possibility of increasing the recoveries through further processing of the gravity tailings and possible processing of the oversized material via initial grinding. This is the most important area to monitor, because any improvements on the 60% recoveries modeled, will significantly increase earnings. If we approach this story with a very conservative view, then we can get in at conservative base case levels with moderate expectations and limited downside risk. Should these expectations be exceeded, which is a real possibility given the factors mentioned above, then the share price will respond and shareholders will be rewarded.
Bottom line
This is a situation that potential investors can be patient with, as production is not expected to commence until Q4. This provides plenty of time to be patient and buy on dips (support seems to be at 15 cents). If the company is able to display positive recoveries (60% or more) during the commissioning of their mill in Q4, then this will surely move the share price more towards the $0.25/share range. At this point the share price is valued at a “wait and see price”, and will likely trade at these “show me” levels over the next few months until the commissioning reveals what we can truly expect from this operation.
At this point considering the preliminary nature of both the metallurgical studies and the PEA, coupled with the possible exercise of warrants, the 2% NSR royalty of Kilroy, the current $1200 gold price, and the pending aggregate $8 million in property payments expected in years 4-5, we feel considering nothing else, the valuation of the saprolite operations at approximately $0.13 per share based of 60% recoveries and full exercise of warrants. However, this is a level we feel provides limited downside risk but is positioned for considerable gains should certain factors play out. This $0.13 per share ignores the potential mining of the hard rock resources which contains close to 600,000 ounces grading 1.20 g/t, nor does it consider the 100K ounces of gold contained within the oversize material and gravity tailings that could be unlocked with the update/expansion of the processing circuit. This is a likely scenario considering unlocking those 100K ounces would increase the revenue by over 50%, and could be modeled to also process the hard rock ore, in turn potentially unlocking a further 600K ounces.
During condemnation auger drilling within the proposed processing plant area, the company encountered mineralization grading 2.0 g/t within the 6 meter auger depth. This mineralization lies outside of the PEA resource estimation, but the company will be going back to drill test this area further. There is obviously plenty of near surface mineralization on this property to explore further that may become future mill feed, so this story clearly has room to grow.
Potential Catalysts and Events to Monitor:
- Initial Production (Q4 2015)
- Initial Recoveries of 60% (Q4 2015-Q2 2016)
- Saprolite Exploration

JUN


