
Gold
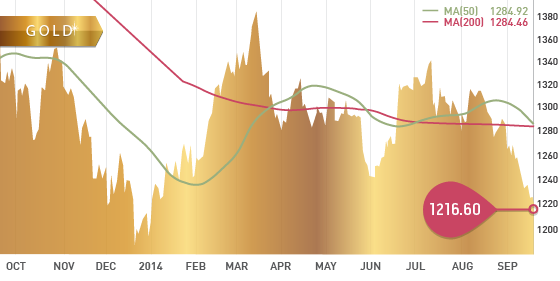
Gold is now at an 8 month low, closing at $1216.60 per ounce. That is down $15 on the week. Trading began fairly quiet this week. In fact, on Wednesday, gold actually closed at $4.50 higher than last Friday’s close.
However, the big headwind for gold is the continuing strength of the US dollar, which is now up 10 weeks in a row. The Fed announced on Thursday that a faster hike in US interest rates might be on the horizon. Since Thursday, gold has sold off significantly.
Physical demand in India is expected to rise from the current import levels of 50-60 tonnes per month to 70 to 75 tonnes in the upcoming months due to festivals.
India Festivals
- Dhanteras – Lakshmi – The Goddess of wealth is worshipped (October 21st)
- Diwali – Festival of lights (October 23rd – October 28th)
- Wedding Season (through to early 2015)
Technicals:
- 50 day moving average: $1284.92
- 200 day moving average: $1284.46
Silver
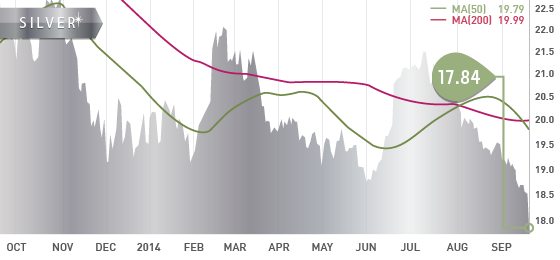
Silver closed at $17.84 per ounce. Research from the CPM group estimates silver supply at 977.6 million ounces this year, which is up slightly from 971 million in 2013. They also mention that demand will continue to trail supplies this year. The demand in ETP (Exchange Traded Products) remains strong and is up 1.5% to 19,898.8 tonnes, reaching near-record levels.
Technicals:
- 50 day moving average: $19.79
- 200 day moving average: $19.99
Platinum
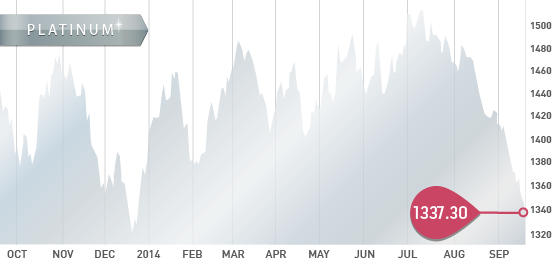
Platinum closed the week at $1,337.30 per ounce as the price continues to struggle since the end of July. The declining price comes as a bit of surprise with the strike that occurred earlier this year. It goes to show you that demand is weaker than expected and the Mail and Guardian has estimated that the above ground inventories are enough to last one year.
Technicals:
- 50 day moving average: $1441.04
- 200 day moving average: $1434.42

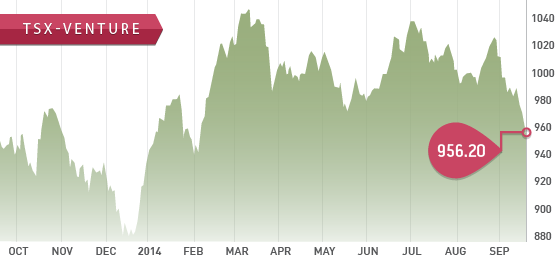
It was a very tough week for the TSX Venture with all 5 days in the red, closing at 956.20. The next support level is 940 and if that breaks, the next level is all the way back to 890 which was in December 2013 (tax loss selling). As we mentioned last week, the Canadian markets are driven by commodity prices which remain under pressure mostly due to US Dollar strength. Investors need to remain cautious and look for bargains especially in the mining sector. The volume on the TSX-V remains weak and is at summer levels.
A Look Ahead
The key items on the calendar this week are:
- September 22 Monday – Existing Home Sales
- September 24 Wednesday – New Home Sales
- September 25 Thursday – Employment Claims
- September 26 Friday – GDP Q3 Estimate

Quebec development companies were sent out on Thursday. Quite a few of the Quebec development companies score well as the cash position average is $2.8 million and the average reserves are 1.5 million ounces.
Next up is Alaska and Yukon companies. We have completed the exploration companies and the results are dismal. The highest scoring company is a 52 and many of the companies have not issued a property related press release in the last 12 months.
As we go through the data in our Tickerscores.com database, we continue to see weakness in the majority of companies that do not yet have a defined resource (exploration companies). Cash positions continue to decline and liabilities are increasing. In the long run this is unsustainable and we will see many of these companies go bankrupt. There is also a big opportunity for when things turn around.
That said, after a preliminary look through Development companies in Northern Canada / Alaska, there are some very interesting names there. Keep posted for our update on that within the coming 7-10 days.
Top 10 Fall update:
Mart Resources – MMT.T – Mart presented at the First Energy conference in London this week. I listened to a webcast of the presentation – nothing I did not already know. The pipeline is still on track according to Wade (CEO) to be in the next couple weeks. Wade was also on BNN this week which can be found here.
Midway Gold – MDW.T – Midway announced on Monday morning that mining has started at the PAN project. Severe rainfall has caused a 1 month delay in the schedule but production is still expected to commence before year end. We remind investors the PAN project has a 32% IRR at $1200 gold.

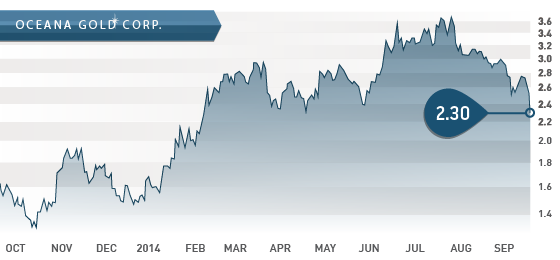
- Symbol: OGC.T
- Price: $2.30
- Shares Outstanding: 301,190,187
- Market Cap: $692,737,430
- Cash: $46,207,000 (June 30,2014)
This week we feature OceanaGold, an emerging gold producer in New Zealand and the northern Philippines. OceanaGold caught my attention this week as I was listening to the audio of company presentations from the Denver Gold Forum. With the decline of the gold price in the last several weeks, I was looking for a company that at current prices would still generate free cash flow. OceanaGold fits that bill and has potential for share price appreciation.
Oceana operates two mines in New Zealand: Macraes and Reefton Goldfields. In the first Q1 of 2014, 102,133 ounces were produced at the two mines at an all in sustaining cash cost of $1,226 per ounce.
The key asset regarding free cash flow for OceanaGold is the Didipio Mine in the Philippines. The mine commenced production in April 2013 and the current mine life has production occurring until 2029. An updated NI 43-101 resource estimate is due at the end of October. Production at the mine is expected to average 100,000 ounces of gold and 14,000 tonnes of copper. All in sustaining cash costs at this mine are negative $150 per ounce of gold, when you take in the copper by-credits.
Note: We did feature OceanaGold as stock of the week on November 23rd, 2013 at $1.68 a share. An after the close order on OceanaGold pushed the stock down to $2.08, as we believe it was deleted from an index which caused funds to sell.
Bottom line: OceanaGold is one of the top performing gold stocks in the last 12 months. The strong performance is due to the free cash flow yield being among the best in the gold space (source Macquarie Research). We expect the strong free cash flow to continue in 2015/2016, resulting in continued share price appreciation for OCG shareholders.
Catalysts:
- Q3 results (free cash flow)
- Dipidio 43-101 resource update (end of October)
- Dipidio increased second half production
- Will continue to pay down another $30 million in debt this year
- A merger with another company (A news release was out this week discussing a potential merger with Alacer Gold (ASR.T) that is apparently off the table for now)
AUG


