
Gold
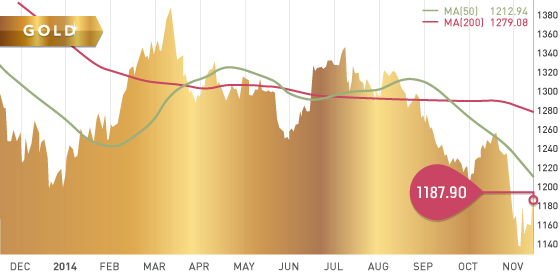
Gold spent most of the week in the red around the $1160 level, but experienced a surprise surge on Friday to close at $1187.90, up $9.20 on the week. The uptick came right after gold dipped from strong retail sales out of the US. In a strange trading pattern, gold made strong moves up through out the day, what many are attributing to short covering before the weekend. A similar move was seen last Friday as well, perhaps indicating that traders do not want to be caught un-hedged against a geopolitical incident over the weekends.
Gold broke through key resistance at $1179 rising $42 off the low put in the earlier that morning. However, the price bounced off the next solid resistance level of $1193.55, which showed the bears don’t want to let gold break through that mark and past the $1200 level. Next week will be interesting for gold at these levels, especially with the plethora of sensitive economic data due next week out of the US.
As the Swiss Referendum vote draws near, we may see some strengthening of the gold price, as investors don’t want to be caught on the wrong side of the vote. Despite expectations of a “no” vote, there is too much at stake regarding the price of gold for investors to simply ignore the possibility of a “yes” vote.
The World Gold Council Released its report on Gold Demand Trends for the third quarter of 2014. It the report the WGC found that gold demand declined 2% compared to the same period last year. The WGC warns however that the 2% decline is compared against the events of Q3 2013, which saw the strongest jewellery demand since 2008. The third quarter of this year actually displayed a market in good health, with jewellery demand slightly stronger then the 5 year quarterly average. Indian demand (up 60%) was the main supporter, representing 34% of Q3 jewellery demand. Though China’s jewellery demand was down 39% year-on-year, it is still in line with their 5-year quarterly average.
Central banks continue to buy with virtually no selling, adding 92.8 tonnes in Q3, marking the 15th straight quarter of net purchases. The data so for indicates that central bank buying is on pace to surpass last years total of 409.3 tonnes. Russia was the main buyer this quarter, purchasing 55 tonnes to add to their vaults, now standing at 1150 tonnes.
Supply was down 7% year-on-year, with the 25% decline in recycling contributing the most to the supply reduction. Mine supply increased 1%, most likely attributed to a general increase in production by companies to offset lower gold prices.
The HUI/Gold Ratio is at a ridiculous 0.1419, basically indicating that despite the current gold price, the miners are significantly undervalued. The ratio has only been below 0.20 twice in the history of the ratio (1996-present). Once during a brief 6 month period in the second half of 2000, and second, from April of 2013 to present. For the ratio to move back above 0.20, never mind getting back to its long term average of around 0.35, the price of gold would have to drop to $850, while the stock price of the miners remain unchanged. Or conversely, the miners would have to appreciate roughly 40% at the current gold price. This just shows how undervalued these miners are right now, and we’re not even discussing this in the context of the long term average ratio. This appears to be an opportune time to pick up gold producers at discount levels. Names like Goldcorp, New Gold, Primero, Detour Gold, Agnico Eagle are all solid gold producers that will reward the investors that saw past the smoke screen and acknowledged the discrepancies.
Technicals:
- Support: $1,179.01
- Resistance: $1,193.55
- 50 day moving average: $1,212.94
- 200 day moving average: $1,279.08
Silver
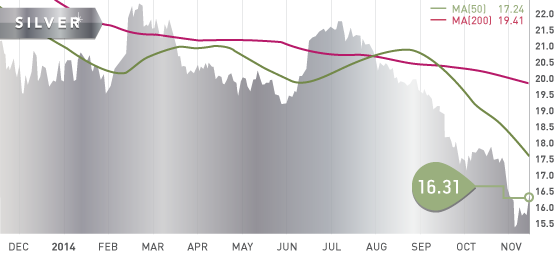
Silver made a strong move as well on Friday, actually up more on the day than gold. Silver was up 4.3% on the day, eclipsing gold’s still impressive 2.2% gain. This helped bring the gold/silver ratio down to 72.8, still exceptionally high. As with gold, silvers move was a result of traders exiting the US dollar as rate hike expectations wane, while also short covering the precious metals sector.
Similar to the HUI/Gold ratio, the AUX/Gold ratio is probably even more disturbing. The AUX index, which tracks 16 major gold and silver producers, is extremely undervalued. The AUX/Gold ratio currently stands at a preposterous 0.0596. The only time it was remotely close to this level in the 30 year history of the AUX index, was back in the fourth quarter of 2008 during the financial crisis. The ratio at that time of crisis, was 0.11, and the low prior to that was 0.16 in the summer of 2000. The 16 gold and silver produces in the AUX index would have to appreciate 85% just to get back to 2008 crisis levels, never mind back to the mean.
Of course there are reasons for the punishment of the miners; disappointing earnings, excessive CAPEX expenditures during the peak years, overspending, etcetera, etcetera. However, the fact remains, that costs have gone up over the years due to inflation, but also due to the fact that the because the easy deposits are mostly depleted, it takes a lot more money to discover and extract ore then ever before. The current cost cutting measures being employed by these companies can only go so far. Eventually there will be a tipping point either with an increase in the price of gold and silver, or with eventual positive earnings resulting from successful cost cutting and optimization strategies. Or perhaps both. Either way, these beat down ratios will eventually regress back to the mean.
Technicals:
- Support: $15.00
- Resistance: $16.64
- 50 day moving average: $17.24
- 200 day moving average: $19.41
Platinum
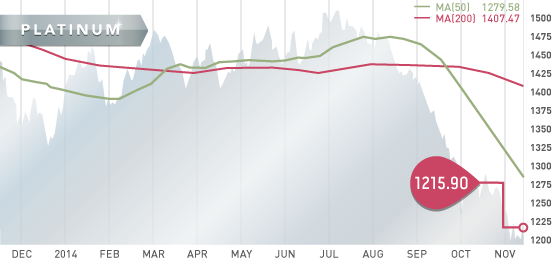
Platinum was also a benefactor of the US dollar selloff on Friday. Although the metal put in a new 5 ½ year low at $1177.50 Friday morning, it quickly regained its composure and bounced back $38.40 to close the day at $1215.90, basically flat on the week. Platinum is currently down 12% on the year.
Technicals:
- Support: $1,177.50
- Resistance: $1,259.23
- 50 day moving average: $1,279.58
- 200 day moving average: $1,407.47

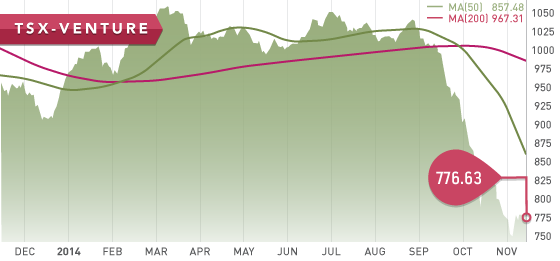
Both the TSX and Venture were up once again to end the week. The TSX was largely moved by precious the metals and oil sectors. Up 152 points on the week, the TSX is now up for the fifth week in a row after bouncing off the low experienced in mid-October.
For the second week in a row the Venture was propped up on Friday from technical trading and short covering of the precious metals. The venture closed the week at 776.63, up a modest 6.37 points.
A Look Ahead
As we keep an eye on economies around the world, particularly on the recovery of the US, the condition of the Euro Area, and the growth in China, the key economic items on the calendar this upcoming week are:
Monday Nov. 17
– Balance of Trade (EA) – Consensus: £10 billion
– ECB President Speech (EA)
– Industrial Production (US) – Consensus: 0.2%
Tuesday Nov. 18
– PMI (US): Consensus: -0.1%
Wednesday Nov. 19
– BoJ Interest Rate Decision (JPN) – Consensus: 0%
– Building Permits (US) – Consensus: 1040K
– Housing Starts (US) – Consensus: 1025K
– FOMC Minutes (US)
Thursday Nov. 20
– Inflation Rate YoY, MoM (US) – Consensus: 1.7%, -0.1%
– Initial Jobless Claims (US) – Consensus: 282K
– Existing Home Sales (US) – Consensus: 5.17 million
Friday Nov. 21 –
– Inflation Rate YoY, MoM (CDN) – Forcast: 1.98%, 0.19%
It is a busy week ahead for the US, with a number of economic reports to be released that will all be used by the market to predict the outcome of the FOMC meeting next month. One of the main focuses this week will be on the FOMC minutes from last month’s Fed meeting, which will help clarify the committee’s sentiment towards the much anticipated rate hikes. Also of importance will be the speech from ECB President Mario Draghi on Monday.
Last Week: China’s trade surplus increased $45.4 billion, beating the consensus. The increase is due in part to an 11% increase in exports to the US. Meanwhile, China’s inflation remained cautiously low at 1.6%. Initial jobless claim out of the US came in higher then expected, placing more uncertainty in regards to the strength of the recovery. October’s retail sales out of the US were slightly stronger than the consensus. Inflation rate and GDP out of the Euro Area were mostly in line with consensus, but still quite low.

An updated Nevada Producers will be out shortly, with newcomer to the category, Klondex Mines (KDX.TO), garnering top spot. The company is well positioned to weather the current depression of precious metals prices, and will benefit considerably with an increase in the gold price off of these levels.
As we approach year-end, the Tickerscores team is beginning to compile our Top 10 report, which we anticipate will be out near the end of December. Considering the undervalued state of the mining industry, we feel there are a number of high-quality companies that are trading at unreasonable levels compared to their net asset value and future potential.
Our goal with the Top 10 report is to identify these companies, which also have the ability to whether the current storm, and also posses the best leverage to a higher price environment.

![]()
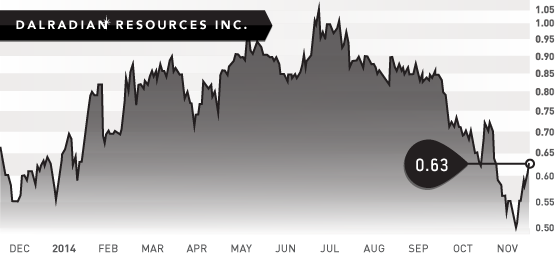
- Symbol: DNA.TO
- Price: $0.63
- Shares Outstanding: 140,035,483
- Market Cap: $88.2 million
- Cash: $37 million (As of September 30th)
- Significant shareholders: Management & Directors (5%), Sprott Asset Management (18.2%), Rosseau Asset Management (14.9%), Front Street Capital (9.1%).
Note: Dalradian has not been ranked by Tickerscores, as Ireland is not a jurisdiction covered at the moment. However, considering their strong management team, solid financial position, excellent economics, and high-grade resource, we feel it would be a top ranked development company.
This week we showcase Dalradian Resources (DNA.TO), a company that has a very promising project located in a country not at the top of investors minds when it comes to gold mining. The company’s Curraghinalt deposit is a high-grade gold deposit located in Northern Ireland. The company is run by a strong management team, in a strong financial position, with a project that host a high-grade resource displaying very encouraging economics.
Curraghinalt Deposit
Dalradians’ Curraghinalt Project is a lode gold system consisting of a structurally controlled series of high-grade veins. The deposit hosts a measured and indicated (M&I) resource of 3 million tonnes containing 1 million ounces of gold at 10.41 g/t. The deposit also hosts an inferred (Inf.) resource of 8 million tonnes containing 2.5 million ounces of gold at 9.67 g/t. The company has been successful in upgrading inferred ounces into the indicated category, an outcome the expect to repeat with the updated resource estimate due in the summer of 2015.
With an underground drill program slated for the first quarter of 2015, the company will gain more confidence in their model, and a better understanding of the deposit. There is good access to underground exploration and development due to the existence of a 412 meter adit, and 325 meters of lateral drifts from a previous underground development program.
Though much of the area is covered in glacial overburden, there are early indications from the minimal outcrops, and a few step-out holes, that the vein system trends for a considerable distance along strike. This indicates that the deposit may be open along strike extensively to the southeast and the northwest. The step-out holes 1.7 km to the southeast have returned promising results, such as hole 12-CT-173 which returned 4.72 meters of 14.82 g/t.
Economics
Dalradian released the results for its updated Preliminary Economic Assessment (PEA) at the end of October. The economics of the Curraghinalt Gold Deposit are very encouraging, and have displayed robust economics in a base case $1200 gold environment. With the updated PEA, the company was able to increase the after tax NPV8% from $467 million to $504 million despite the price of gold used in the PEA dropping from $1378 to $1200. Although the IRR dropped to 36.2% and the payback period increased slightly to 2.6 years, the PEA was able to increase the average grade mined and increase the life of mine (LOM) gold production, while also lowering the production costs. The CAPEX and sustaining capital increased by 30% and 48% respectively since the 2012 PEA, but that is offset by the near 700,000 ounce increase in LOM production.
In the last two months, the company has commenced a Pre-Feasibility Study (PFS), and an Environmental Impact Assessment (EIA). The completion of both of these reports will be a big step toward a potential construction decision. Investors should be aware that the economics presented in the PEA are based on both (M&I) and (Inf.) resources. It is expected that much of the inferred resources will be upgraded in the next resource estimate, however nothing is certain.
Management
The management team of Dalradian is the same management team that founded and eventually sold Aurelian Resources. Aurelian was a market darling during 2006, eventually being bought out by Kinross for $1.2 billion in 2008. The Dalradian team is also supported by a very strong team of directors such as Sean Roosen, Ronald Gagel, and Jonathan Rubenstein.
Management holds 5% of the shares, and has bought close to 900,000 shares since the beginning of the year. Most notably director Sean Roosen purchased 100,000 in the public market two weeks ago. Sean Roosen is also the Chairman and CEO of Osisko Gold Royalties (OR.TO).
Northern Ireland
North Ireland, being part of the UK, is separate from the Republic of Ireland. The latter has a very stable mining climate, rated 4th best place for mining investment, out of 112 jurisdictions rated by the Fraser Institute.
We expect Northern Ireland would generate a similar rating as its brother to the south. This should give investors of Dalradian some peace of mind and encouragement, in regards to an efficient permitting process and acceptance of the project through social licence. In August, as part of Northern Ireland’s commitment to support business, investment, and job growth, the government offered Dalradian $590,000 towards the Curraghinalt Project. As unemployment is a key issue in Northern Ireland, projects such a Curraghinalt receive strong support from both the government and local communities. The project has excellent regional infrastructure, and is situated directly northeast of the Galantas Gold (GAL.V) Omagh gold deposit, a small open-pit mine currently undergoing underground permitting.
Bottom line:
The Curraghinalt deposit is a high-grade, low CAPEX deposit situated in a top mining jurisdiction. The company is well cashed to move forward, and is run by a highly experienced team of management and directors. With a PFS underway, underground drilling, and an updated resource estimate expected in Q2 of 2015, the Curraghinalt project should continue to see improved economics and advancement towards a construction decision. However, we at Tickerscores would not be surprised though if Dalradian doesn’t get a chance to make a construction decision before being bought out.
Note: Sprott Private Wealth LP holds 11,200,000 shares as part of the recent $27 million financing in August. Those shares were issued at $0.90 per unit and are subject to a statutory hold period until December 1st 2014. This may add some selling pressure on the stock during December as some investors may elect to take a tax-loss on the stock, considering the stock trades at 30% below the issue price. This would potentially present a good buying opportunity.
Potential Catalysts and Events to Monitor:
- Pre-Feasibility Study (Q4 2015)
- Underground Drilling (Q1 2015)
- Resource Update (Summer 2015)
- Environmental Impact Assessment preparation and Submission
NOV


