
Gold
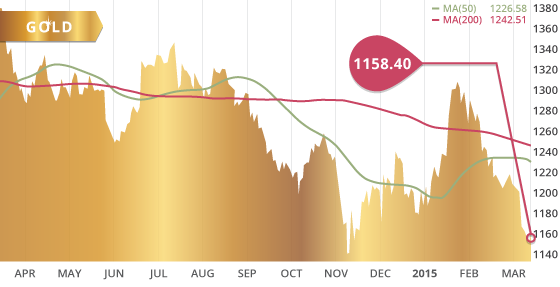
Gold was down $9.80 to close the week at $1158.40. In the process, the metal put in a fresh 3-½ month low during Wednesday’s trading. Despite that, and being down over $10 during intraday trading on Wednesday, it was interesting to notice the gold miners were actually up 4% on the day. This may have merely been investors buying the oversold gold sector, or perhaps it is indicating something else. In either case, a 4% rally on a down day is not something to ignore.
The $1159 level marks short-term resistance, which is capped by a declining trend line that also coincides with the 100 hour MA. Above this mark gold will be looking towards the $1185 level as a possible test. Support remains around the $1142 level, which will be an area to watch during the FOMC statement and Yellen’s commentary on Wednesday. Should the priced in expectations of the market be fulfilled by the FOMC, then gold will look to test $1142 and possibly the $1131 low of November 7th. If the sellers are able to push gold below the $1131 level, then the next area of solid support is at the $1086 level.
With the market so overweight in the dollar, a correction to the dollar is looming and overdue. The U.S Dollar Index pushed above 100 for the first time in 12 years, while weak economic data continues to spill out of the country, Going back to mid-1970, the rate at which the dollar has been strengthening is higher than at any point. This should be cause for concern for investors as well as central bankers. The FOMC announcement on Wednesday may prove to be the catalyst that sparks a U.S. dollar correction should they fail to confirm the markets expectations, which are already priced into the market. This scenario would be positive for the gold price, and is something to be prepared for. We expect the market to get caught off guard at some point during 2015, since the U.S data to this point has been far from strong enough to warrant such a move in the U.S dollar or the current level of confidence in the recovery of the U.S. economy.
Technicals:
- Support: $1,142.65
- Resistance: $1,185.11
- 50 day moving average: $1,226.58
- 200 day moving average: $1,242.51
- HUI/Gold Ratio: 0.139 (Last week 0.143)
Silver
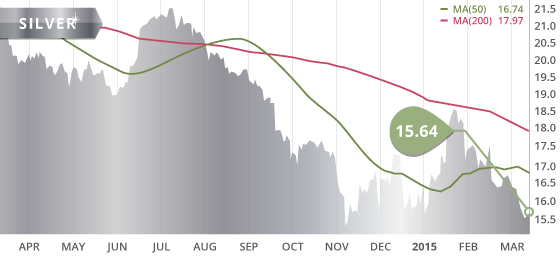
Silver was down 29 cents to close the week at $15.64, after briefly dipping below the $15.51 support level. The metal recovered during the last two days of the weekly session, and though it was breached, the $15.51 area still provides support. The $16.05 level is a level of resistance reinforced by a declining trend line from the late-January highs. If the metal is able to break through $16.05, the next test will be around the $16.89 level. Meanwhile, the XAU/Gold ratio closed at a 3-month low last week.
Technicals:
- Support: $15.51
- Resistance: $16.05
- 50 day moving average: $16.74
- 200 day moving average: $17.97
- Gold/Silver Ratio: 74.07
- XAU/Gold Ratio: 0.0566 (Last Week: 0.0579)
Platinum
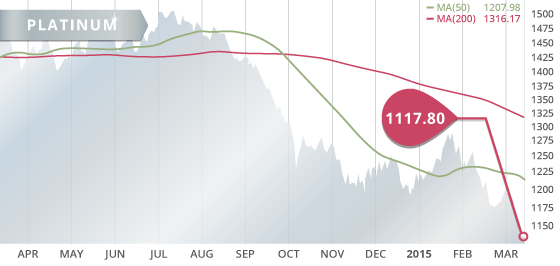
Platinum fell another $41 during the week to close at $1117.80, down 3.5%. However, the metal happened to find support at the $1100 mark, which we mentioned last week as an area of potential support. A near 14-year long ascending trend line from the $400 level in 2001 adds further supports to this area. This is a critical level for the metal, as there appears to be minimal support below this trend line and the $800 level. However, if a test of this trend line is confirmed over the next couple of weeks, then this could possibly be the bottom, and a potential buying opportunity. For this to be accomplished buyers will need to come in to support the price at this level and push it upwards; otherwise platinum may be destined for $800.
Technicals:
- Support: $1,100.00
- Resistance: $1,195.20
- 50 day moving average: $1,207.98
- 200 day moving average: $1,316.17

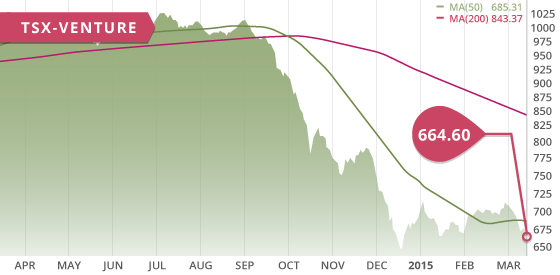
The TSX and the TSX-V were both down on the week, 1.48% and 3.51% respectively. The mining sector, down 4.62% on the week, was a heavy contributor to the declines of the two exchanges. The gold sector was down 1.76% on the week, although this was a far cry from last week’s 11.7% decline. Despite the declines, the gold miners did manage to recover some losses during the second half of the week, gaining 5% off of the intra week low on Wednesday. The base metal sector was down 3.83% on the week, even though copper gained a few cents, now at $2.67. The base metals are now down 8.8% over the past two weeks giving up all the gains made in the New Year.
A Look Ahead
As we keep an eye on economies around the world, particularly on the recovery of the US, the condition of the Euro Area, and the growth in China, the key economic items on the calendar this upcoming week are:
Monday March 16
– Empire State Manufacturing Index (US) – Consensus: 8.00
– Industrial Production (US) – Consensus: 0.2%
Tuesday March 17
– BoJ Press Conference (JPN)
– Economic Sentiment Index (GER) – Consensus: 58.7
– CPI (EA) – Consensus: -0.3%
– Building Permits (US) – Consensus: 1.065M
– Housing Starts (US) – Consensus: 1.050M
Wednesday March 18
– FOMC Economic Projections and Statement (US)
– Fed Chair Yellen Speaks
Thursday March 19
– Philly Fed Manufacturing Index (US) – Consensus: 7.4
Friday March 20
– Core CPI YoY (CAN) – Consensus: 2.1%
– Core Retail Sales MoM (CAN) – Consensus: 0.1%
This week the markets will be focused on the much-anticipated FOMC meeting on Tuesday and Wednesday. The economic projections as well as Yellen’s commentary afterwards will be market movers on Wednesday. With the market fully pricing in the removal of the word “patience” from the Fed commentary, as well as expectations of a mid-year rate hike, any moves by the Fed on the contrary will most certainly lift gold and provide the U.S dollar with a catalyst for a much overdue correction. On the other hand, if the Fed confirms the markets suspicions, then gold will experience continued selling pressure.

We are now working on Ontario Developers after having completed Mexico Developers. MAG Silver claimed top spot while Chesapeake Gold moved up 3 spots to claim second, and Torex Gold dropped two spots to round off the top 3.
The Mexico report will be released very shortly.
Top 10 Updates:
Red Eagle Mining (RD.V) announced this week that the company has received the final permit for their San Ramon Gold mine in Colombia. The company will now look to complete project financing, with initial construction expected to commence in mid-2015. This is a huge step for the company and allows them to proceed forward with their production plans at San Ramon. The economics of the deposit are very robust, and at the current gold price, the project would generate an after-tax NPV at an 8% discount, of $60 million, with an IRR of 40% and a payback of 1.5 years. Although this is a small deposit to start, there is considerable resource expansion potential on the property.

![]()
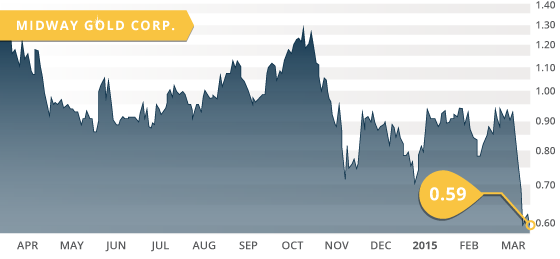
- Symbol: MDW.TO
- Price: $0.59
- Shares Outstanding: 176,545,337
- Market Cap: $104.2 Million
- Cash: $5 million in working capital
- Significant Shareholders: Multiple Institutional Holdings (46%), Directors & Officers (4.8%)
Note: Midway Gold ranked #1 in our most recent Nevada Developers update. With initial production to commence by the end of March, Midway will now join the Nevada Producers their first quarter of production is behind them.
Midway Gold (TSX:MDW) (NYSE:MDW) is a gold company constructing their flagship Pan Gold Mine in Nevada. The company also holds two other development stage projects in Nevada; the 100% owned Gold Rock Gold Project, and the 75/25 joint venture Spring Valley Gold Project. The reason Midway has been chosen as “stock of the week” is that the share price has experienced considerable selling pressure as a result of information contained within the March 3rd Pan Project Update.
The main factor in the March 3rd press release was the announcement that the early sampling of the ore grade has shown it to be lower than the design grade. Another factor is the anticipated $5 million shortfall in working capital as a result of the 2-week delay from the initial targeted mid-March gold pour. This delay was a result of a pump failure that has now been rectified.
These two factors had the share price shedding 37%, and in turn trimming close to $60 million off of the market cap. This depreciation is most likely warranted given the circumstances. The economics of the Pan project are very sensitive to fluctuations in the design grade. A 10% decline in grade equates to a reduction of $40 million in the NPV of the project. However, with much of the risk now removed, we feel this presents a good buying opportunity, especially if the company is able to reconcile their design grade. The independent engineering firm engaged to review the project, as well as the sampling after the initial gold pour and sustained production, should both help to clarify these early ore grade concerns.
We feel this is a safe entry point, because even if the grades are in fact 10% lower, this has already been more than priced into the market cap. If the ore grade is more than 10% lower, then this would be a huge error in the resource modeling of the Pan Project. It would be quite unusual to incur such a large error, especially in the simple geology of open-pit Carlin-style gold deposits. One possible explanation for the lower ore grades could be excess mine dilution, which may just be initial mining inaccuracies that can easily be improved upon.
Pan
Midway officially broke ground at Pan in January of last year, with the company recently announcing that construction is now 93% complete and on budget. The initial gold pour is anticipated by the end of March. The 2011 feasibility report showed initial capital costs at $84.2 million before contingency and working capital, and as of the March 3rd announcement the company has spent $76 million to date, and the $84 million is still expected to be the final price tag. The project contains proven and probable reserves of 864,000 ounces of gold grading 0.56 g/t, and a measured and indicated resource of 1.13 million ounces grading 0.44 g/t.
Using a gold price of $1200, the 2011 feasibility study generated an after-tax NPV5% of $123 million, with an IRR of 32% and a payback of 2.6 years. These are all excellent numbers, although if the above-mentioned design grade cannot be achieved then these numbers will surely suffer. However, this potential situation is already priced into the share price.
Gold Rock
The company’s second project is the Gold Rock Gold Project, also located in Nevada, approximately 10.5 km southeast of Pan. This is another typical Carlin-style deposit with the potential to become another low-CapEx, low-cost, open-pit heap leach mine possibly larger then Pan. The project contains a measured and indicated resource of 513,000 ounces of gold grading 0.79 g/t, and an inferred resource of 536,000 ounces grading 0.69 g/t. Midway expects to make a possible construction decision on the project by years end, with targeted production for 2017.
Spring Valley
The company also owns a 30% interest in the Spring Valley Gold Project, with Barrick Gold recently completing the $38 million in expenditures to earn their 70% interest in the project. Barrick as operator has budgeted $11 million in 2015 for the completion of a pre-feasibility study as well as additional exploration. The project contains a measured and indicated resource o 3.8 million ounces of gold at a grade of 0.74 g/t, and an inferred resource of 880,000 ounces of gold grading 0.65 g/t.
Barrick funds everything up to production to earn a total 75% interest in the project. Midway will retain their 25% interest and Barrick will recover Midway’s share of capital from 90% of Midway cash flows. Spring Valley represents a low capital, low-cost, oxide heap leach project that has the potential to become an additional source of revenue for Midway.
Bottom line
We feel with the market already discounting the share price over 35% in the last two weeks, this presents a good buying opportunity to position oneself in a growing company, and possibly partake in a positive re-pricing should the company confirm and realize their design grade. With the first gold pour expected by the end of the month, this is a good time to take a position in a company that is weeks away from initial revenue generation. It is also a bonus that this company also has two other development stage projects that both have the potential to become near-term producers.
Potential Catalysts and Events to Monitor:
- Initial Production (End of March)
- Resource Verification and Grade control/reconciliation (Early 2015)
- Potential Gold Rock Construction Decision (H2 2015)
- Spring Valley PFS (Late-2015)
MAR


