
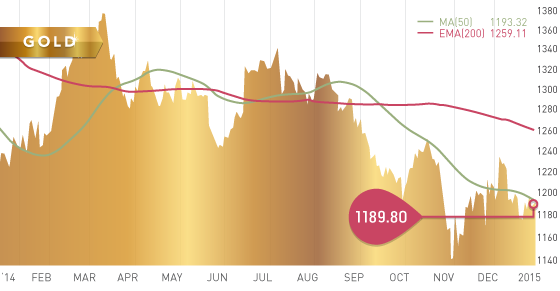
Gold ended the year at $1183.20, down 1.8% in 2014, and down for the second year in a row. However, as the chart showed in last weeks “Weekly Trends”, gold has been the second best performing currency in 2014 next to the U.S. dollar. 2014 also saw gold put in a new four-year low of $1130.40 on November 7, which marked a 40% decline since the highs reached in 2011. With a certain degree of volatility, gold has rallied off the November lows to trade around the $1200 level, as it now enters a strong period of seasonal strength. Gold ended the week down only slightly thanks to a 2% resurgence off of Fridays low of $1167.30. This resurgence was a result of weak economic data out of the U.S. on Friday morning.
With many countries offering lower and lower yields on their bonds, we appear to be heading towards a zero-yield environment for these safe fixed assets. As a result, this puts gold on a level playing field. In this scenario gold should attract investors and find price support, especially considering we are entering this period of seasonal strength for gold.
Technicals:
- Support: $1,167.30
- Resistance: $1,239.00
- 50 day moving average: $1,193.32
- 200 day moving average: $1,259.11
- HUI/Gold Ratio: 0.141 (Last week 0.136)
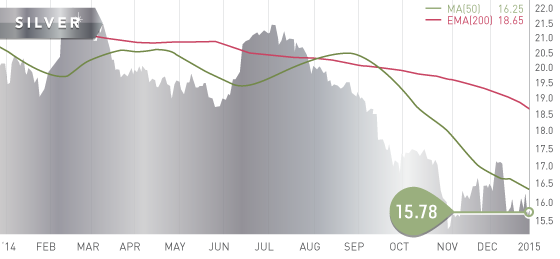
Silver
Silver ended the year at $15.60, down 20% on the year. Usually silver and gold move in tandem, however silver clearly underperformed gold in 2014. This is further evident by the gold/silver ratio hovering around the 75 level. This presents an excellent buying opportunity for silver and silver miners, considering many anticipate a major rebound for the metal in 2015. Silver investors continue stacking physical silver as well as buying silver ETFs pushing their holdings to all time highs. This investment demand coupled with increasing industrial demand will be the two main drivers of the silver price going forward.
The $15.50 level held up once again this week on two separate occasions. That is now five times over the past three weeks that buyers have stepped in at that level. For now that remains solid short term support. However, as mentioned last week, if that line fails then we will be looking at $15.00 for support once again.
Technicals:
- Support: $15.50
- Resistance: $17.80
- 50 day moving average: $16.25
- 200 day moving average: $18.65
- Gold/Silver Ratio: 75.40
- XAU/Gold Ratio: 0.0593 (Last Week: 0.0572)
Platinum
Platinum closed the year at $1209.50, down 12% in 2014. However Palladium was up 11% on the year to $792.72, claiming the top spot as best performing precious metal in 2014. This is due to supply concerns over Russia, which is the top producer of the metal. Platinum was down $12 on the week to close at $1204.70 after trading as low as $1187.70 early Friday morning.
Technicals:
- Support: $1,175.60
- Resistance: $1,260.00
- 50 day moving average: $1,219.44
- 200 day moving average: $1,371.89


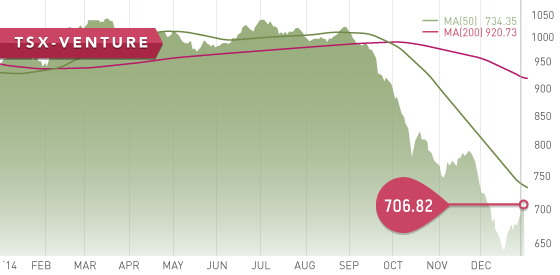
The Venture ended the year at 695.53, down 25.3% on the year. All of the losses occurred in the last 3 months of the year. The Venture rallied in the last two and a half weeks to gain back some of the ground given away late in the year. The Venture reached an all time low of 637.06 in mid-December. The TSX ended the year at 14632.44, up 7.4% on the year, but this is well short of the highs reached in early September when the TSX was up 15% on the year. The fourth quarter declines experienced by the both TSX and TSX-V was a large result of the collapsing oil price which has declined 50% since the June highs. The energy sector has declined 20% this year. The base metal group was down 14% on the year as a result of slowing growth in China.
A Look Ahead
As we keep an eye on economies around the world, particularly on the recovery of the US, the condition of the Euro Area, and the growth in China, the key economic items on the calendar this upcoming week are:
Monday Jan. 5
– Inflation Rate YoY (DE) – Consensus: 0.4%
Tuesday Jan. 6
– ISM Non-Manufacturing PMI (US) – Consensus: 58.0
– Factory Orders (US) – Consensus: 0.8%
Wednesday Jan. 7
– Unemployment Change (DE) – Consensus: -5K
– ADP Employment Change (US) – Consensus: 240K
– Balance of Trade (US) – Consensus: -$42B
– FOMC December Minutes (US)
Thursday Jan. 8
– Balance of Trade (CHN) – Previous: $54.5B
– Factory Orders (DE) – Consensus: -0.8%
– Initial Jobless Claims (US) – Consensus: 290K
– Consumer Credit Change (US) – Consensus: $15B
Friday Jan. 9
– Inflation Rate YoY (CHN) – Forecast: 1.49%
– Employment Change (CA) – Forecast: 22K
– Non Farm Payrolls (US) – Consensus: 243K
We are now officially in the new year with an eventful and tumultuous 2014 behind us. This week we have a number of market sensitive data points due out, particularly from the U.S., China, and Germany. With the ECB looking to inject QE at the end of the month, data points out of the EA, especially out of Germany will be closely watched. On Monday the German December CPI is expected to decrease once again to 0.4% growth, well below the standard 2% target. Markets closely watch the German CPI data, as it is released ahead of the national tabulation. The market will also be watching the unemployment numbers and factory orders out of Germany for QE clues.
The situation developing in Greece will also be a focus this month with Greek elections being held January 25th. There is a sense that a Greek exit from the Euro is a strong possibility. The weakening scenario in the Euro Zone has been lending strength to the U.S. dollar, but gold should begin to benefit from the economic issues plaguing the EA and many other economies around the world.
Chinese CPI data out on Friday is expected to be weaker, which should help fuel the markets expectations of further Chinese stimulus. There are numerous data points out of the U.S. this week, especially on Tuesday, Wednesday, and Friday. The markets are sure to be somewhat volatile on these days as traders chew through the data and try to anticipate the timing of Fed rate hikes. Although jobs data out of the U.S. is less of an issue then it was during 2013/2014, it is still an important indicator of the health of the U.S. economy.
Last Week: The New Years holiday week was fairly quiet. However, data out of China showed further weakness in the country with the manufacturing PMI falling to 50.1, an 18-month low. This news out of China put pressure on the metal sector on the week up until data was released out of the U.S. on Friday. Manufacturing data out of the U.S. on Friday was below expectations and raised concerns about the potential that the Fed may delay the rate hike longer than expected, which sparked gains by the precious metals. The housing market in the U.S. continues to be a concern with the Case-Shiller Home Price report showing the 11th straight month of decelerating gains. Mortgage rates are near 19-month low, yet the low rates have yet to attract more buyers into the market. This is most likely a result of lacklustre wage growth in the country preventing any encouraged buyers.

The Tickerscores team is busy preparing the Top 10 report which we anticipate will be out sometime next week. Following the release of the Top 10 report we will have an updated Nevada Developers out shortly after.
The “Stock of the Week” performance during the fourth quarter of 2014 showed a gain of 11.5%, outperforming an equal investment in the TSX-V or the TSX by approximately 20% and 10% respectively.


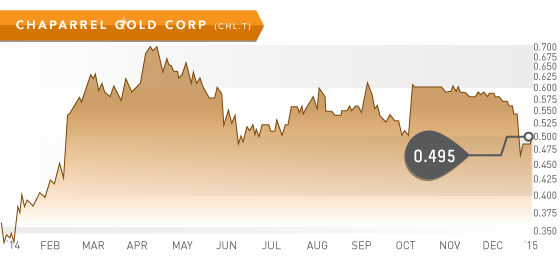
- Symbol: CHL.V
- Price: $0.495
- Shares Outstanding: 117,685,976
- Market Cap: $ 58.8 million
- Cash: $37.5 million (As of Sept. 30)
- Significant shareholders: Waterton Precious Metals Fund (19.7%), MM Asset Management (11.4%), TIG Advisors (8.2%), Management and Directors (2.6%)
Note: Chaparral Gold is a new addition to Nevada Developers which is close to being finalized. However, at this point we do not have the final Tickerscore for the company. With that said, Chaparral did generate a financial score of 99 in the pending update – the highest of its peers.
Chaparral Gold Corp. (CHL.V) is a well-capitalized gold exploration company with two high-quality assets in Nevada. Chaparral was spun out from the takeover of International Minerals (IMZ) by Hochschild Mining in late 2013. This left Chaparral with all of IMZs non-Peruvian assets, including the Goldfield and the Converse properties in Nevada, as well as roughly $58 million in cash and receivables. Subsequent to the spin out, Chaparral had fended off hostile takeover attempts by Waterton during the first half of 2014. However, Chaparrals management and shareholders finally agreed to Watertons most recent bid of 61 cents per share. The deal is expected to close on February 2nd, although a failure of Chaparral to secure both a repayment and consent from Junefield may put the deal in jeopardy. We feel that the 61 cent valuation is low given the companies cash position (32 cents/share) and high-quality assets in Nevada. If we include the cash receivables owed to Chaparral from Junefield then the cash position would be approximately $51 million (43 cents/share). Therefore we feel a fall through of the deal may in fact be a better scenario for shareholders. In either case, at the current price, the company remains undervalued and should offer shareholders positive returns going forward.
Goldfield
The Goldfield deposit contains a measured and indicated resource of 1.3 million ounces at 1.1 g/t., including proven and probable reserves of 567,000 ounces at 1 g/t. Chaparral is advancing through permitting towards a construction decision. The potential Goldfield mine scenario would be an open-pit heap leach operation. The low-cost operations of this scenario generates positive economics for the deposit. The 2013 updated feasibility study demonstrates solid economics, although a base case of $1350 gold was used. The pre-tax NPV5% of the deposit is $113.7 million with an IRR of 23%. However, at $1200 gold the pre-tax NPV5% is still quite positive at $64 million with an IRR of 16%.
Converse
The Converse deposit contains a measured and indicated resource of 6.1 million ounces of gold at 0.5 g/t of gold and 38 million ounces of silver at a grade of 3.3 g/t. This is a low grade deposit that will need a much higher gold price to be economic, as displayed by the 2011 PEA conducted by IMZ. Using a base case of $1300 the pre-tax NPV5% is $185 million with an IRR of 10.5%. Not a robust deposit at the current gold price by any means. However, there’s no question there is gold and silver in the ground.
Bottom line
Chaparral’s proposed sale for 61 cents/share represents a 23% premium to Fridays close of 49.5 cents/share. We feel there is a good chance the deal will fall through due to the potential non-waver of the consent of Junfield Resources to assign the receivables, owed by Junefield to Chaparral, to Waterton Fund II. Also, Junefield wishes to renegotiate the timing of the payments of the receivables. This lack of cooperation by Junefield may result in one or more of the parties terminate the deal. However we feel this could prove to be a positive considering that the 61 cents per share seems to undervalue the company. Chaparral is in a very healthy financial position with $37 million in cash and no debt. The company holds two high-quality projects in Nevada, both with developed resources with reasonable economics. Whether the transaction goes through or not, we feel the current share price offers a safe entry point with little downside, yet potential for significant 20% gains or more.
Potential Catalysts and Events to Monitor:
- Sale of Chaparral (Closing Feb. 2 2015)
- Goldfield advancement towards construction
JAN


