
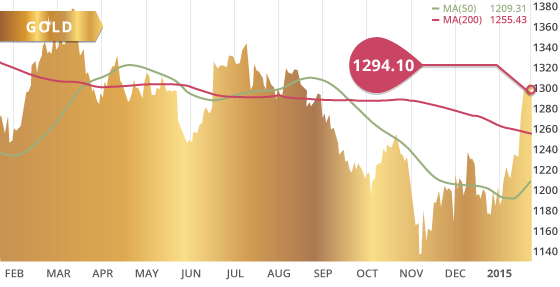
Gold had another strong week while breaching the $1300 mark for the first time since mid-August. However, the metal met stiff resistance around $1307 and could not sustain the upward momentum and eventually fell back below $1300 on Friday. Gold ended the week up $39 to $1294.10, or 3.1%.
The announcement of a €1.1 trillion QE program by the ECB on Thursday helped the metal reach a 5-month high. Gold also breached a 20-month downtrend on Wednesday and Thursday, but was unable to remain above the trend line to end the week. We will need to see gold push again this week to confirm the breakthrough. There is also a 17-month trend line in place around $1325 that the metal will need to hurdle. Once clear through both of those trend lines, there is only one more in place in the low $1500’s, which is in place from the all-time high of September 2011.
The metal is riding a 3-week support line that may see a test of support this week. As such, gold will need to close the week above $1300 to keep this trend line intact, otherwise solid support is around $1270 and then at $1245. Further supporting the gold price is speculators continuing to increase their net long positions in gold for the 4th straight week.
With the stimulus measures announced by central banks around the globe, most recently by the ECB, investors are showing concerns that all of the money being injected into the system will eventually come out in the wash. Inflation would naturally be expected as a result of all the money creation, however deflationary forces are heavily at work, and we are seeing central banks around the globe pulling out all stops to prevent deflation. Deflation is like “kryptonite” for central banks. They have all the tools to manage inflation, yet deflation is a whole other beast that they don’t have the tools or proven models to deal with. In some sense, we are approaching somewhat uncharted territory. This uncertainty will continue to support gold and silver, as we are witnessing by the unusually correlated strength of both the U.S. dollar and gold. This current correlation will end at some point, but it will not be gold providing the weakness – over the long run, a stronger dollar is not sustainable in this precarious economic environment.
There are three reasons for this. A stronger dollar hurts U.S. exports and therefore economic growth. It also stifles inflation which the U.S. is trying so hard to achieve, and finally it creates financial asset bubbles that are bound to burst, and which the FOMC wants to avoid.
Technicals:
- Support: $1,267.63
- Resistance: $1,309.71
- 50 day moving average: $1,209.31
- 200 day moving average: $1,255.43
- HUI/Gold Ratio: 0.152 (Last week 0.157)
Silver
Silver reached a 4-month high while ending the strong week at $18.33, up 3%. Silver touched the 200 day MA for the first time since early August, but after touching the trending three times this week, the metal wasn’t able to break above the moving average. There is a cluster of resistance marks between $18.33 and $19.50, so a push through to the mid $19 range would be a positive sign for the metal and help clean up that price range. There is little resistance in the way towards $21.50, however this level marks an area of considerable resistance. Solid support remains at $16.89, although silver may find short-term support around the $17.60 level.
Technicals:
- Support: $16.89
- Resistance: $19.04
- 50 day moving average: $16.46
- 200 day moving average: $18.46
- Gold/Silver Ratio: 70.6
- XAU/Gold Ratio: 0.0605 (Last Week: 0.0621)

Platinum
Platinum closed the week relatively flat at $1269.60, while hitting 3-month highs during the week. The metal will look to break above the 200 day moving average this week for the first time since early-August. Platinum closed below gold of Friday, which is unusual for the precious metals pair. Although the lower global growth projections by the World Bank and the IMF may indicate lower demand for commodities, the weak supply side scenario for platinum and palladium are supportive of higher prices, and should offset the decline in demand.
Technicals:
- Support: $1,221.75
- Resistance: $1,310.20
- 50 day moving average: $1,222.35
- 200 day moving average: $1,359.29


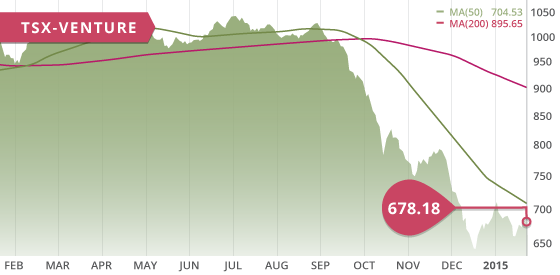
Like most other markets, the TSX was up on the week thanks to the widely anticipated announcement of QE from the ECB. The TSX was up 470 points to close the week up 3.3%, thanks in part to a 7% increase by the energy sector. The TSX-V was also up at 1.6% to close the week at 678.18.
Copper extended its decline this past week to close at a 5 ½ -year of $2.49, as the outlook for global growth continues to deteriorate. The metal is down over 11% this month alone. As a result, the base metal sector was down 4.3% on the week. Oil closed at 45.49 on Friday after bouncing around the $46 level for most of the week.
The Canadian dollar closed Friday at 80.49, shedding nearly 3 cents on the week. As a result of the QE announcement by the ECB, the Euro dropped significantly and in turn boosted the U.S. dollar, as it continued to push higher while reaching an 11-year high. What is interesting, is that when the dollar was last at these levels gold was essentially at its lowest levels. The strength of gold in light of this is in stark contrast to the usual USD and gold inverse correlation. It will be interesting to see how gold responds when the dollar finally pulls back. This strong faith and rush to the dollar is awfully familiar to what occurred in 2008/2009, when concerning economic conditions triggered a flight to safety, first into the dollar, and then into gold. It is likely that the strong flight into gold is being delayed or perhaps overshadowed by the concurrent strength of the dollar.
A Look Ahead
As we keep an eye on economies around the world, particularly on the recovery of the US, the condition of the Euro Area, and the growth in China, the key economic items on the calendar this upcoming week are:
Sunday Jan. 25
– Greek Parliament Elections (GRK) – Polls: Syriza Wins
– Balance of Trade (JPN) – Consensus: -¥740.3B
Tuesday Jan. 27
– Durable Goods Orders (US) – Consensus: 0.5%
– Case-Shilller Home Price MoM (US) – Consensus: -0.1%
– Markit Services PMI JAN Flash (US) – Consensus: 53.7
– CB Consumer Confidence (US) – Consensus: 95.0
– New Home Sales (US) – Consensus: 450K
Wednesday Jan. 28
– Fed Interest Rate Decision (US) – Consensus: 0.25%
Thursday Jan. 29
– Initial Jobless Claims (US) – Consensus: 301K
– Pending Home Sales Mom (US) – Consensus: 0.5%
– Japan Data: Inflation, Industrial Production, Unemployment
Friday Jan. 30
– Inflation Rate YoY (EA) – Consensus: -0.5%
– Interest Rate Decision (RU) – Consensus: 17%
– GDP MoM (CA) – Prior: 0.3%
– GDP Growth Rate QoQ (US) – Consensus: 3.3%
– Core PCE Prices QoQ (US) – Consensus: 1.2%
This week started off with Greek parliament elections today, with Syriza coming out with a win. This verdict has the potential to severely rattle markets this week.
Sensitive items out of the U.S. this week include the consumer confidence, durable goods orders, and Core PCE data. Initial jobless claims will be scrutinized as the they have been above 300K for two weeks in a row, with the 4-week moving average continuing to increase. Once again we keep an eye on housing data out of the U.S. this week with the Case-Shiller data, as well as new and pending home sales.
With the ruble under attack, the markets will be watching for any more rate hikes out of Russia this week.
Last Week: The big event last week the widely expected QE announcement by the ECB, with the size of the stimulus program double what was expected. The ECB announced that they will be buying €1.1 trillion in bonds over a period from March of this year to September of 2016. This announcement continued to push the euro to an 11-year low, and had markets rallying around the globe.
The Bank of Canada shocked the market by cutting its interest rate by a quarter percent to 0.75%, marking the first cut by the bank since 2009 as a result of the declining price of oil. Housing data out of the U.S. was mixed to weak, with building permits lower then expected and existing home sales slightly lower then consensus. GDP growth in China was in line with expectations, which showed their weakest annual growth in nearly 25 years.

The Tickerscores team was busy this past week attending the Vancouver Resource Investment Conference in Vancouver, Canada. We were there exhibiting for the two day show, as well as presented with a panel of representatives from 3 mining companies: Tahoe Resources, Western Copper and Gold, and Rockhaven Resources. The big news at the show on Monday was the announcement by Goldcorp that they are acquiring Probe Mines for $526 million, at a 50% premium. This is great news for the sector, and created much welcomed buzz at the show.
Probe Mines was one of the Top 10 companies included in our most recent report, issued just days before the buyout.
Nevada developers will be released this week, with Midway, Corvus, Paramount, and West Kirkland, all showing strong rankings once again. New addition Chaparral Gold also ranked well, and was covered as pick of the week on January 4th.
Our mining analyst will also be attending the AMEBC RoundUp conference this week in Vancouver, Canada. The conference is a mining event more focused towards the technical side of mining. Our analyst will be out scouting the developments of new and existing projects.


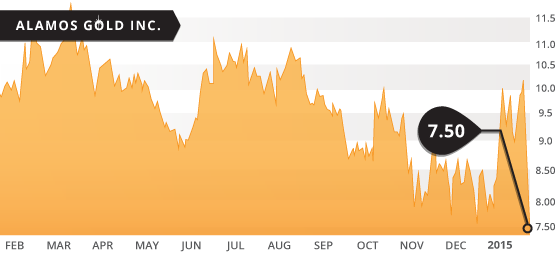
- Symbol: AGI.TO
- Price: $7.50
- Shares Outstanding: 127,357,486
- Market Cap: $955,181,145
- Cash: $360 million
- Significant shareholders: Van Eck (12.7%), Fidelity Management (7.8%), Neuberger Berman (5.5%), Tocqueville Asset Management (4.3%)
Alamos Gold (AGI.TO) is a low-cost gold producer in Sonora Mexico, with a strong growth profile of advanced-stage projects in Mexico, United States, and Turkey. The open-pit heap-leach Mulatos Mine in east-central Sonora is one of the lowest cost gold mines in the industry, at $700-$740 per ounce. The company is in an excellent and enviable cash position with $360 million in cash, and no debt, with the cash position representing close to 40% of their market cap. The company also pays out a semi-annual dividend of $0.10 per share, representing a yield of 2.67%. With their strong cash position, and strong growth profile, we do not feel this dividend is in jeopardy.
We have chosen Alamos as pick of the week, as we feel that the recent sell-off has presented a good long-term buying opportunity, but may also present a short-term opportunity to benefit from a bounce in the share price. The company reported disappointing 2014 production results last week, and as a result the market has punished the share price 25%. The 2015 guidance was also disappointing, and showed weaker production numbers expected for the year ahead. However, management was very transparent in their announcement and did not try to sugar coat the 2014 results, or try to hide the lowered expectations for 2015. The company stated that they will not jeopardize their long-term plan to achieve short-term profitability. This was refreshing to read, and shows us that this is a company with a strategic growth plan, and are not compelled to deviate from this plan to satisfy the markets in the short-term.
Production has dropped off significantly since 2012, with 2014 production down 30% compared to 2012. The Mulatos Mine produced 140,500 ounces of gold in 2014, well below their guidance of 150,000 to 170,000 ounces. Management announced the same production guidance for 2015 as 2014, although with higher production costs expected. The 2015 guidance issued by the company was on the conservative side and also assumes an average $1200 gold price, which should mitigate further disappointment in 2015. On the other hand, a conservative guidance may also offer room for upside surprises.
The cash costs are expected to increase roughly 10% over 2014 as a result of three main factors. The first two factors are a higher strip ratio and lower grade ore stacked on the leach pad. These two factors will occur as the company works through a higher-strip and lower-grade portion of the deposit, which is expected, as it is built into their long-term mine plan. The third factor that will be contributing to the expected higher cash costs, is the increasing haulage distance going forward. 25% of the leach pad ore in 2015 will come from the El Victor and San Carlos pits, which are 4km and 7km away from the crushing circuit respectively. However, this extra distance (that was not a factor in 2014), as well as the 3km haulage distance from the Mulatos pit, should be offset somewhat with oil prices down over 50%. Alamos is one company that will benefit significantly from a weakening oil price, yet also from a strengthening U.S. dollar against the Mexican Peso. The U.S. dollar has appreciated close to 7% against the peso in the past two months. These two market conditions will improve the bottom line in 2015, in a year when the company works through a lower production period of their mine plan. This is fortunate timing for these two economic scenarios to occur during a lower-production period in the company’s mine plan.
In 2014 the company sold 134,600 ounces of gold at an average price of $1263 an ounce. The lower 2014 production was largely a result of abnormal rain during the rainy season effecting gold recovery from the leach pad, as well as effecting crusher throughput. This deferred production was expected to be recovered in Q4, however a portion of the deferred Q3 production will be realized in the first quarter of 2015.
With the company providing a conservative 2015 outlook, yet a turnaround year expected in 2016 generating increased production at lower costs, we feel the dips in 2015, including the current selloff, presents good buying opportunities to build a position to benefit in 2016 and beyond. 2017 production will benefit from the development of the Cerro Pelon and La Yaqui satellite pits. These two pits average double the budgeted grade for 2015, and will significantly add to the production at Mulatos. In addition, Alamos has a strong low-cost growth profile of development projects that offers an investor additional value creation in the years ahead. These projects are internally funded from the cash flow generated from the company’s low cost operations. Alamos has consistently grown their resources since 2007, growing 300% in that timeframe to approximately 12 million ounces currently.
Bottom line
This is a long term suggestion for those that have the fortitude and patience to hold a company with a weak short-term outlook, but a strong long-term growth profile. This stock has taken a severe beating in the last three days of trading, and perhaps there is more to come. The company missed on their Q4 and 2014 guidance while showing a number of areas of weakness. However, the company isn’t trying to hide it, or play it off, yet has a plan in place to achieve their growth projections. They are also being transparent about the weakness expected for 2015, and have issued conservative guidance as a result. The fact that the company is being so transparent is part of the reason why we believe the company will reach their goals for 2016/2017, and why we have chosen them as pick of the week.
We expect the share price to find support at some point this week now that the market has sufficient time to digest the disappointing numbers and make the appropriate calculations based on the company’s 2015 guidance. We could get a small bounce before financials are released in mid-late February, and perhaps we will see more selling on that news. However, a strong gold price will help lift this company despite a soft guidance for 2015. The company is sticking to their long-term plan and has no intentions of altering course for short-term profitability, and we believe they will be rewarded in due time. The company is in an excellent and enviable cash position with approximately $360 million in cash, representing close to 40% of their market cap, and no debt. We will see $13 again for this company, and potentially a lot more. It may take a year or two, but at $7.50 with a 2.67% dividend yield, it is worth the wait.
Potential Catalysts and Events to Monitor:
- Q4 and Annual Financials
- 2015 expected production grades and recovery
- Heap Leach Ore (0.80 g/t Au), (73% recovery)
- Mill Ore (9.5 g/t Au), (75% recovery)
- 2015 Expected Throughput
- Mill (550 tpd)
- Heap leach (17,300 tpd)
- 2015 Average Gold Price Assumption – $1200
JAN


