
Gold had a breakout week following the surprise announcement by the Swiss National Bank (SNB), which shocked financial markets and had traders turning to gold. The SNB announced that they will no longer be pegging the Swiss franc to the euro, a 3-year relationship that most currency traders assumed was a sure thing. However, the SNB decision proved otherwise, and in the process sent the financial world into turmoil.
The financial fallout from the announcement is yet to be quantified, as the dust is far from being settled. However, it is situations like these that allow gold to shine as the ultimate safe haven currency. With a global economy in such fragile condition, and so intertwined by the ever more intricate models designed to achieve growth and avoid the inevitable, it only takes one catalyst to knock forward the domino. It is for this reason why so many gold and silver proponents hold the metals in such high regard – because they see a flawed system.
It is difficult to say if the SNB announcement is in fact a domino or not. Time will tell. However, it should serve as a wake up call to those that put full faith in fiat currencies while disregarding precious metals in the process.
Gold shot up instantly upon the announcement and closed the day up $33.50, and in the process confirmed last week’s breakthrough of the 6-month trend line. On Friday gold continued to push another $17.70 to close the week at a 4 ½ month high of $1280.30, up 4.7% on the week. The push on Friday had the metal breaking through a 10-month trend line in place since March of last year. (Note: I mistakenly, or perhaps presciently, wrote the break of the 10-month trend line in last weeks write-up, instead of the 6-month like I meant to). Gold also broke through the 200 day MA on Thursday, and closed above it on Friday for the first time since August 15th.
Following the break of the 10-month trend line, gold will need to battle through two longer-term trend lines in place within $50 above the current price, as well as through a cluster of resistance marks in the low $1300s. Once above that regiment of resistance, there is little in the way to deter gold’s ascent. If gold is pushed back down it should find support around the $1245 level, however, if that level doesn’t hold then solid support looks to be around $1205.
Another positive supporting the gold price at the moment is that speculators have raised their net long position in gold for the third consecutive week, increasing their positions 7.5% on the week to a near five-month high. We also continue to see improvements in the HUI/gold ratio for the third consecutive week, which continues to reflect buyers entering the sector and resulting share appreciation of the miners.
According to the latest monthly report from the World Gold Council, Russia’s central bank was busy adding another 18.8 tonnes of gold to its reserves which now stand at 1187.5 tonnes. These gold reserves account for 10.8% of Russia’s total foreign reserves.
Technicals:
- Support: $1,124.50
- Resistance: $1,297.00
- 50 day moving average: $1,197.87
- 200 day moving average: $1,255.49
- HUI/Gold Ratio: 0.157 (Last week 0.152)

Silver
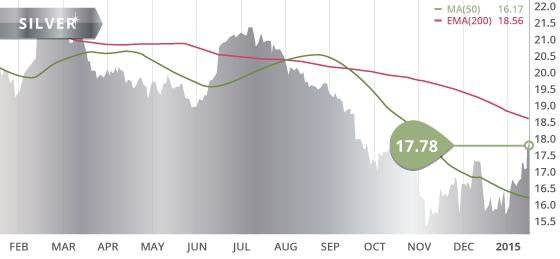
Silver ended the week at $17.78, up 7.6% on the week, and 12.6% over the past two weeks. However, despite silver’s strong performance, gold’s was stronger, pushing the gold/silver ratio over 70 once again. This was the first full week that silver remained above the 50 day MA since late July.
The metal made a nice run on Friday to test resistance at the $17.80 level, and will most likely break through this level next week. However, we feel there will be significant resistance at the $18.20 level, as this was a previous floor prior to silver breaking below $18 in September. Coinciding with the $18.20 level is a 3 ½-year trend line from the August highs of 2011, as well as two retracement marks, and also the 200 day MA is in the vicinity at $18.49. All of these factors combined should offer significant resistance to price moves.
Of course, with the fallout from the SNB announcement, the precious metals may continue to see buyers flock to the market. Therefore, the $18.20 level may be no match for the strong buying pressure. This will be a very interesting week to watch.
As with gold, the net long positions in silver also increased for the third consecutive week with speculators increasing their positions 30% on the week, while reaching a five-month high.
Technicals:
- Support: $16.89
- Resistance: $18.20
- 50 day moving average: $16.24
- 200 day moving average: $18.49
- Gold/Silver Ratio: 72.00
- XAU/Gold Ratio: 0.0621 (Last Week: 0.0623)
Platinum
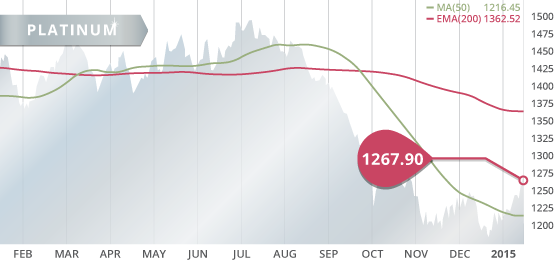
Platinum closed the week strong and continued its climb up from the December low. The metal was up 2.8% to $1267.90 on the week, the highest since October 29th. However its PGM brother palladium was under strong pressure last week, collapsing 7.2% since Tuesday. The metal hit a three-month intraday low on Friday before settling in at $756.90, down $46.60 on the week. It is interesting to note that metal has obeyed the 200 day MA quite remarkably, bouncing off of the resistance line six times since October.
Technicals:
- Support: $1,221.75
- Resistance: $1,310.20
- 50 day moving average: $1,215.67
- 200 day moving average: $1,366.76

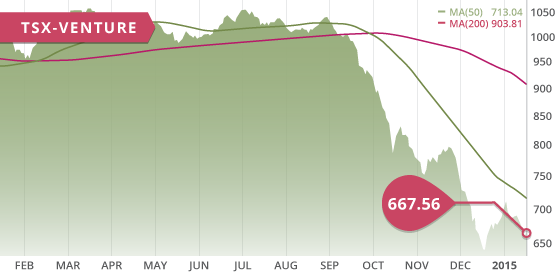
The TSX was in the red for most of the week, being down 300 points at the intraweek low on Wednesday. However, the TSX found its legs on Friday, surging over 250 points on the back of miners and energy stocks, with precious metals surging and both copper and oil stabilizing. Despite this end of week charge, the TSX was still down 75 points on the week, closing at 14309.41 for its second straight weekly decline. The TSX-V also spent the majority of the week in the red until a small surge was put in on Friday. The Venture ended the week down 2.9%, also for its second consecutive weekly decline. During the week, copper plunged to a 5-year low after the World Bank lowered its global growth outlook.
A Look Ahead
As we keep an eye on economies around the world, particularly on the recovery of the US, the condition of the Euro Area, and the growth in China, the key economic items on the calendar this upcoming week are:
Tuesday Jan. 20
– GDP Growth QoQ, YoY (CHN) – Consensus: 1.7%, 7.2%
– Industrial Production YoY (CHN) – Consensus: 7.4%
– Retail Sales Dec. YoY (CHN) – Consensus: 11.7%
– PPI MoM, YoY (DE) – Consensus: -0.4%, -1.4%
– Zew Economic Sentiment (DE) – Consensus: 40
Wednesday Jan. 21
– Housing Starts (US) – Consensus: 1040K
– Building Permits (US) – Consensus: 1054K
– BoC Interest Rate Decision (CA) – Consensus: 1.0%
Thursday Jan. 22
– ECB Interest Rate Decision (EA) – Consensus: 0.05%
– ECB Press Conference – Consensus: €500 billion QE
– Initial Jobless Claims (US) – Consensus: 300K
Friday Jan. 23
– Core Inflation Rate YoY (CA) – Consensus: 2.1%
– Manufacturing PMI Flash Jan. (US) – Consensus: 54
– Existing Home Sales (US) – Consensus: 5.05M
Although the week starts off fairly quiet with Monday being a holiday in the U.S., this week is sure to be another one filled with volatility. The event that the markets will be most focused on is the anticipated announcement of QE by the ECB. The surprise factor will be in how much or how little is committed to the program. The consensus at this point is €500 billion. Also, to what effect will the recent announcement by the SNB have on the decision of the ECB? It will most certainly be an eventful day. PPI data and economic sentiment data out of Germany on Tuesday are the last significant data points form the country before the ECB QE announcement.
A number of data points are out of China to start the week, including Q4 and annual GDP. With the market pricing in the slowing growth in the country, the GDP number will be watched closely to confirm this outlook.
A number of housing data is out of the U.S. this week which the market will closely watch. The housing sector in the U.S. has been noticeably weak, and an area of concern for the FOMC. With the recent jobs numbers coming in weak, including last weeks initial jobless claims, we get another jobless claims reading on Thursday.
Last Week: The big event last week that overshadowed much of the economic data Thursday and Friday was the surprise announcement by the SNB that shocked the financial markets. The SNB announced that they will no longer support their currency’s peg to the Euro. The day prior to that retail sales out of the U.S. were very weak which triggered a broad market selloff in the U.S. on Wednesday. This data is merely another blemish that further supports the argument that the country is not recovering like we are led to believe. However, consumer sentiment reached an 11 year high, which begs the question; “then why aren’t they buying?
Russia’s trade surplus shrank in November as exports declined the most in five years. Russia’s Foreign Reserves contracted by $33.4 billion in December to $386.2 billion, currently at their lowest level since 2009. Russia announced this week that they will tap into their $88 billion reserve fund in attempts to support the ruble.

The Tickerscores team released the 2015 Top 10 report on Friday which covers a number of companies that we believe should provide their shareholders with significant value creation in 2015.
With the Top 10 report behind us we will be back to normal at Tickerscores with a steady flow of jurisdiction updates. The first of these will be the Nevada Developers which we anticipate will be out near the end of the week. This Sunday and Monday, the Tickerscores team will be exhibiting as well as presenting at the Vancouver Resource Investment Conference in Vancouver, Canada. We will be sure to bring you bring you any interesting news and insights that we come across while at the conference.


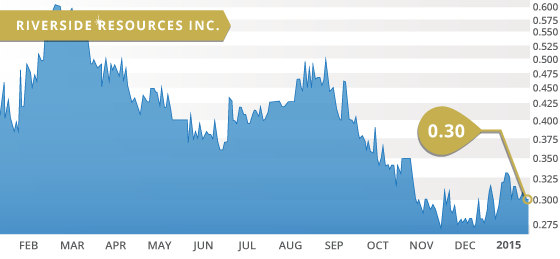
- Symbol: RRI.V
- Price: $0.30
- Shares Outstanding: 37,051,778
- Market Cap: $11,115,533
- Cash: $3.5 million
- Significant shareholders: Management (6%), Adrian Day Asset Management (10%), Sprott Asset Management (5.5%), Rick Rule Family Trust (5.5%), Kinross Gold Corp. (3.5%)
Riverside Resources (RRI.V) is a company not currently covered in the Tickerscores database. The reason being that the company in a prospect generator with multiple early-stage projects located in B.C., Arizona, and Mexico. Therefore, it is difficult to categorize the prospect generators and compare them against their peers.
The company has 7 main projects after recently terminating their option agreement on the Swift Katie copper-gold project, which was being explored through its BC Copper Alliance with Antofagasta Minerals PLC (ANTO.LN). The recent drill results from the reconnaissance drilling of the property did not meet the requirement for further funding. It is these kinds of decisions that enable the company to preserve cash and funding to put towards another property, instead of sinking money into the ground when the results are telling them otherwise. This is a common problem in the exploration industry, and why the prospect generator model offers a good solution. Riverside uses the prospect generator model to increase their chances of a discovery by using partner funds to simultaneously explore multiple properties at once.
Of the 7 main projects that Riverside holds, 4 are partner funded. These include:
- Penoles Gold-Silver Project in Durango, Mexico. ( Morrow Bay)
- Coatan gold property in Chiapas, Mexico. (Paget Minerals)
- Cajon Gold Project in Sonora, Mexico. (Hochschild Mining)
- Sugarloaf Peak Gold Project in Arizona, USA. (Croesus Gold)
Riverside has over $3.5 million in the treasury as well as $3 million in partner funding for 2015 and no debt. The company has a strong portfolio of early-stage gold, silver, and copper properties located in stable jurisdictions. To seek out new property acquisitions or staking grounds, the company has a 75,000 location database of mineral properties that it uses to identify prospects with discovery potential. In addition to combing through their database, the company is actively looking for distressed assets with discovery potential, that are either overlooked or misunderstood.
The management team has been very diligent in maintaining a low share count. Since the end of 2011, management has only increased the outstanding shares by less than 6% in the past 3 plus years, while still progressing with exploration on their multiple properties. For a large part, the company has been able to avoid going to the market over the past 8 years by striking deals with major mining companies. With their strong management team, this past success is sure to continue for Riverside.
Bottom line
This stock will be a bit of a slow play but we feel that at $0.30, it offers a good entry point. Riverside has done an excellent job of maintaining a tight share count, while using partner funding to explore their properties. This model has worked very well so far, and allowed the company to continue exploration on their properties without having to go to the market, in a time when financing is very challenging and exceptionally dilutive.
The company has a healthy portfolio of promising assets, some of which are being funded by partnerships with major mining companies. The company has a large database of exploration properties and a very capable exploration team with strong technical experience to assess the potential of respective properties. It will just take one significant discovery to propel this stock, and with a conservative share count, the gains can become quite significant.
Potential Catalysts and Events to Monitor:
- New property Acquisitions in Sonora Mexico
- Partner Funded Exploration
- Future Partnerships (Tajitos Property?)
JAN


