
Gold started the week by breaking through the short-term downtrend in place since early December, but failed to reach those same December highs. Gold continued to rally to a high of $1223.30 on Tuesday, which represented a $55 recovery off of the one-month low put in the Friday morning prior. After positive ADP numbers out of the U.S., and a change in market sentiment on Wednesday, gold’s rally broke down. However, following non-farm payroll numbers released on Friday, gold pushed higher to close the week at $1223.40, while reaching a 3 1/2–week high. The market finally paid attention to the lack of wage growth in the U.S., which actually showed a 0.2% contraction month over month in December.
This strong move by gold on Friday produced a solid breakthrough of a 10-month trend line, in place since March of 2014. This breakthrough will need to be confirmed this week with another strong performance by gold. The metals next major hurdle is the resistance mark in place at $1239. A break above this mark would have gold looking to test a cluster of resistance marks around the $1260 level, followed by a break through towards the $1300 level.
Gold found support around the $1205 level, bouncing off the area five times during the week. However, solid support remains at $1167.30, which is further supported by a trend line in place since the November lows. We are seeing improvements in the HUI/gold ratio for the second consecutive week. This is evidence that buyers, attempting to capitalize on the beaten down sector, are entering the space. This comes at a time when gold is showing strength, and concerns about the health of the global economy are continuing to mount.
As discussed last week, the collapsing bond yields around the world should be a warning signal for investors. The average 10-year yield on G3 bonds (U.S., Japan, Europe) dipped below 1% last week for the first time ever. This scenario is a positive for gold as it shows trepidation about global economic growth and perhaps about the fragility of the global economy. This event is being dismissed by many mainstream analysts, perhaps convincing themselves and others that this is the “new normal”. However the facts remain, that yields have never been this low, even during the great depression. All this after three rounds of QE, and five years of zero interest rates. Not to mention the stimulus measures undertaken by the EU and Japan. With more stimulus on deck, the QE announcement by the ECB on January 22nd will be very important to monitor.
Technicals:
- Support: $1,167.30
- Resistance: $1,239.00
- 50 day moving average: $1,191.51
- 200 day moving average: $1,256.51
- HUI/Gold Ratio: 0.152 (Last week 0.141)

Silver
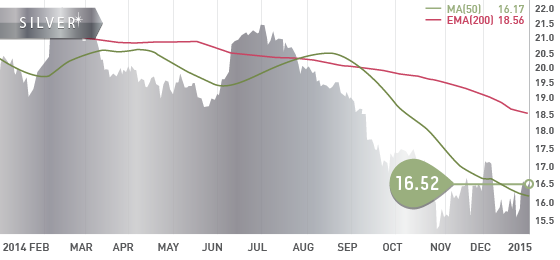
Silver ended the week at $16.52, up 4.6%. In the process, the gold/silver ratio dropped below 70 for the first time in 3 months . Despite this performance, silver still remains in a down trend with considerable overhead resistance to chew through. However, as silver consolidates at these levels it is showing signs of initial strength, as it closed above the 50 day MA for four consecutive days to end the week. A break above $18 would be very positive for the metal, as that level was once solid support prior to silvers collapse in the second half of 2014.
Technicals:
- Support: $15.50
- Resistance: $17.80
- 50 day moving average: $16.17
- 200 day moving average: $18.56
- Gold/Silver Ratio: 68.00
- XAU/Gold Ratio: 0.0623 (Last Week: 0.0593)
Platinum
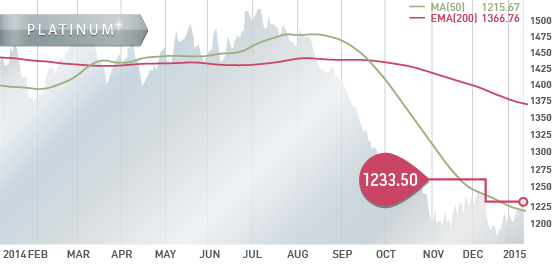
Platinum closed the week at $1233.50, up 2.4%. With the auto sector performing well around the world in 2014, including the U.S., China, and Europe, platinum and palladium should be well poised to benefit from increased demand. Platinum is expected to have a 1.3 million ounce supply deficit in 2015, its lowest since 1975, while palladium is expected to have a supply deficit of 1.6 million ounces. Both cases should be supportive of the price going forward.
Technicals:
- Support: $1,175.60
- Resistance: $1,260.00
- 50 day moving average: $1,215.67
- 200 day moving average: $1,366.76

The TSX began the week by plummeting over 400 points as the price of oil dropped below $50 for the first time since 2009. This caused the energy sector to drop 6% and the metals & mining sector to drop 4%. The TSX recovered slightly at the end of the day to finish down 370 points, but continued its selloff Tuesday with an additional 146 point decline. The TSX was able to gain back some of the lost ground to end the week, but was still down 2.5%.
The TSX-V was also down on the week 2.7%, though not as a result of the mining sector. The drop in both exchanges was largely attributed to the declining energy sector as a result of the drop in oil price. The Canadian dollar also dropped to its lowest level since 2009 as a result of the weaker oil price. During the week, the loonie dropped to a 5 ½ -year low of 84.20, while the U.S. dollar reached its highest point since 2005. Although the stronger dollar puts pressure on the gold price, economic headwinds and concerns over global growth are showing signs of curbing the ascent of the dollar.

A Look Ahead
As we keep an eye on economies around the world, particularly on the recovery of the US, the condition of the Euro Area, and the growth in China, the key economic items on the calendar this upcoming week are:
Monday Jan. 12
– November Balance of Trade (RU) – Prior: $13.6B
Tuesday Jan. 13
– Balance of Trade (CHN) – Consensus: $49.85B
– NFIB Business Optimism (US) – Prior: 98.1
– IBD/TIPP Economic Optimism (US) – Prior – 48.4
Wednesday Jan. 14
– Retail Sales MoM, YoY (US) – Forecast: 0.1%, 5.1%
Thursday Jan. 15
– GDP Growth Rate 2014 (DE) – Consensus: 1.5%
– Balance of Trade (EA) – Forecast: €19.7B
– Foreign Exchange Reserves (RU) – Prior: $419M
– Initial Jobless Claims (US) – Consensus: 290K
Friday Jan. 16
– Core Inflation Rate YoY (EA) – Consensus: 0.8%
– Core Inflation Rate YoY (US) – Consensus: 1.7%
– Consumer Sentiment (US) – Consensus: 94.1
– Industrial Production MoM (US) – Consensus:0.1%
This week starts off pretty quiet with Russian Trade Balance the only notable data point to be released on Monday. This data is for November so it is somewhat lagging, considering the situation is Russia has deteriorated further since November. We also keep an eye on Russia’s Foreign Reserve data out this week which will help reveal Russia’s condition as the country attempts to support their currency. They have chewed through roughly 20% of their foreign reserves in the past year in doing so.
We will be getting business, economic, and consumer sentiment data out of the U.S this week, which are all sure to move the market if they miss expectations. We will also get inflation data out of the U.S. and EU which will be closely watched by the market to determine future rate hikes and potential QE measures respectively.
Last Week: There was a slew of data out of the US last week which were mixed, but generally on the weaker side. The release of the FOMC minutes showed the Feds optimism in the U.S. economy, but revealed their concerns over global growth, inflation, and wage growth. These wage inflation concerns were further magnified with the release of Friday’s non-farm payrolls. The data showed an increase in jobs, although a wage contraction of 0.2% month over month. This data point was the cause of a weaker dollar and a surge in the gold price that day. The market is finally paying attention to the lack of wage growth in the U.S. which at this point is not indicative of a growing economy achieving full employment.
U.S. ISM non-manufacturing, and factory orders were both weaker, however the stronger ADP employment numbers foreshadowed the strong increase in jobs of the non-farm payrolls later in the week. The trade deficit in the U.S decreased, though with a decline in exports, the contraction was in fact attributed to a decline in imports. Inflation, factory orders, and employment in Germany were all weak, while Chinas inflation was in line with expectations.

The Tickerscores team is finalizing the 2015 Top 10 report which will be released in just a few days. Following the release of the Top 10 report we will have an updated Nevada Developers out shortly after.


- Symbol: LSG.TO
- Price: $0.90
- Shares Outstanding: 435,432,224
- Market Cap: $392 million
- Cash: $62.2 million CDN (As of Sept. 30) + $15 million FT raise (Dec. 3rd)
- Significant shareholders: Van Eck (14.7%), TD Asset Management (3.3%)
Lake Shore Gold Corp. (LSG.TO) is a well-capitalized and low-cost gold producer in Northern Ontario, Canada. The company holds three multi-million ounce gold complexes located in the prolific Timmins mining camp of the Abitibi greenstone belt. These include the Bell Creek mill and mine complex, the Timmins West mine, and the Fenn-Gib development project. Lake Shore currently produces from the Bell Creek Mine, and the Timmins West Mine, both of which feed a central processing facility at Bell Creek. The company has made substantial improvements over the past 12-18 months, due in large part to the completion of a 3000 t/d mill expansion at the end of Q3 2013. This expansion, coupled with a better understanding of their mining areas, led to a dramatic turnaround in their operations. This turnaround resulted in record production in 2013, and once again in 2014.
This past week the company announced their 2014 production results, which showed record gold production of 185,600 ounces of gold. This was well above the upper end of their 2014 production target range of 160,000 to 180,000 ounces. The company expects to replicate this performance in 2015 with all in sustaining costs expected to be around $1000 per ounce. However, with production grade declining noticeably during the second half of the year, investors will need to keep an eye on quarterly production results to determine if the company will be able to achieve their production target for 2015. The lower grades achieved in H2 of 2014, particularly in Q4, may merely have been the mining of lower grade areas of the deposits that were expected as part of the mine plan, or it may be an indication of what to expect from near-term production. However, these lower grades were somewhat offset by higher throughput in Q3 and Q4. Lake Shore milled an average of over 3400 t/d in 2014, which is well above the mills 3000 t/d nameplate capacity. In addition to maintaining a production grade around 4.8 g/t, the company will also need to maintain this high through-put in order to achieve their 2015 production target. With that said, we feel the company will be able to continue the success they had in 2014, while increasing earnings and strengthening their balance sheet.
Financials
Lake Shore has over $75 million CDN in cash and bullion, including the recently completed $15 million flow-through raise. The company has improved their financial position in 2014 by generating net free cash flow as well as proactively paying off $45 million in debt, which far exceeded their debt reduction target of $20-$25 million for the year. This has removed a substantial portion of liabilities, and positioned the company to remain flexible in this current gold price environment.
Bottom line
Lake Shore has done an excellent job of achieving key production and cost targets during 2014, and looks to continue this strong performance in the new year. With the recent $15 million FT raise, the company plans to aggressively advance their 144 Gap discovery in the Timmins complex. Along with the other exploration progress being made at both Timmins West and Bell Creek, the 144 Gap Zone has the potential to add significant ounces to future production. At this stage it appears that with their exploration success, reserve replacement and reserve growth should not be an issue for Lake Shore. In 2015, investors should closely monitor the quarterly production grade and throughput, to gauge whether or not the company will achieve their production targets, or perhaps exceed them. With that said, we feel that with an increasing gold price going forward, well-structured companies such as Lake Shore will benefit considerably. At 90 cents per share, we feel the upside for the company outweighs the downside risk with gold trading at $1200 and above.
Potential Catalysts and Events to Monitor:
- 2015 Production Target: 170,000-180,000 ounces
- Production Grade: (2103: 4.6g/t), (2104: 4.8g/t) (2015: ?)
- 144 Gap Zone Advancement
- Fenn-Gib Development

JAN


