
Gold
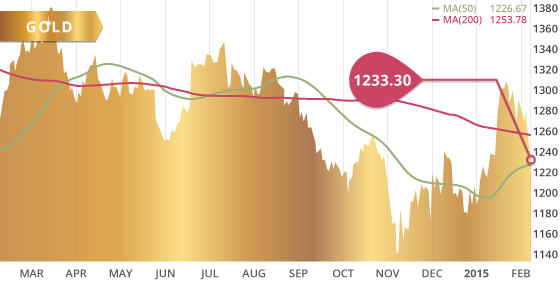
After spending much of the week struggling in the $1255-$1275 range, gold finally plunged to a intraday low of $1228.20 on Friday after strong non-farm payrolls out of the U.S. put the prospect of June rate hikes back on the table. The metal recover somewhat to end the day at $1233.30, but was still down $50.40 or 3.9% on the week. In the process, gold broke below the 200 day MA on Friday which previously seemed to provide support, however that level will now become resistance.
Gold is still in an up trend off of the December/January lows. However the metal will have to hold at these levels, otherwise the resilience of this January rally will be put into question. There is near-term resistance at the $1239 level which is a retracement mark that is an area of failed support as a result of Friday’s plunge. The $1239 level also corresponds with highs of December 9th and 10th. The next level of resistance above that comes in at the $1252 level which marks the 200 day MA, as well as a retracement mark from the move up from the January low, and also corresponds with the October 21st high. Gold bounced off of the $1228.20 level on Friday which is essentially the level of the 50 day MA. This level may provide near-term support, however a break below would have the metal eying support at the $1205 level.
The sellers have gained momentum with Friday’s jobs data, and now the prospects of a near-term FOMC rate hike have strengthened. This will continue to put pressure on gold, and with the dollars continued strength and the perception of U.S. economic picture increasing, gold may face some short-term pressure moving forward. A key date the markets will be watching closely will be February 24th, when Jannet Yellen of the FOMC will be before Congress to give her semi-annual testimony. With the recent strength of U.S. data, the markets anticipate she will give an indication of June rate hikes. This statement will most certainly impact gold, and may be a date one would want to stay on the sidelines until the dust settles. If there is no change in the “patient” language or indication of a near-term hike, then that would be disappointing to investors expectations, and would be positive for gold. However, the magnitude of a selloff in gold if June rate hikes are confirmed far out weigh the magnitude of buying should their be no change in the patience of the FOMC in regards to hiking their benchmark interest rate.
Technicals:
- Support: $1204.50
- Resistance: $1,252.71
- 50 day moving average: $1,226.67
- 200 day moving average: $1,253.78
- HUI/Gold Ratio: 0.156 (Last week 0.157)
Silver
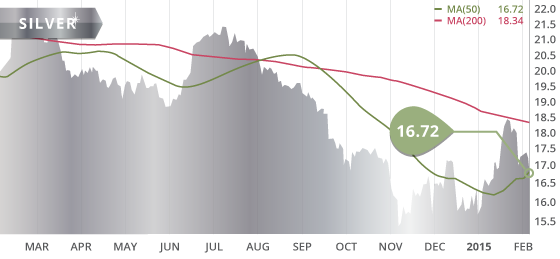
Silver gave back ground once again this week, while following gold’s lead after the better then expected jobs data on Friday. The metal closed the week at $16.72, down 3.1% from last week. Short term resistance stands at $17.36, however above that, the $18.50 level still marks significant resistance. Silver breached the 50 day MA on Friday, but we will have to wait to see if the sellers show up once again on Monday to confirm the breakthrough. The selloff last week has taken much of the steam out of the January rally and now the metal is showing signs of weakness. Near-term, the metal will likely test support at $16.53 once again, however that level is unlikely to hold, as the strong break below the trend lines from the lows of Decembers and January, has placed the metal in a bearish environment. Therefore solid support is at $15.48, a level where buyers showed up on a number of occasions in December.
Technicals:
- Support: $15.48
- Resistance: $17.36
- 50 day moving average: $16.72
- 200 day moving average: $18.34
- Gold/Silver Ratio: 73.76
- XAU/Gold Ratio: 0.0624 (Last Week: 0.0618)
Platinum
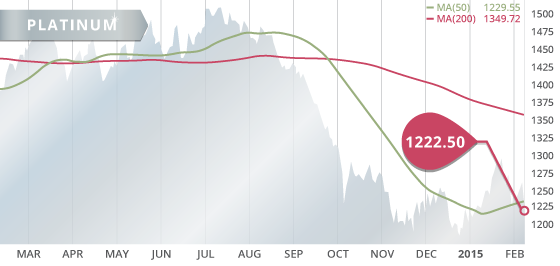
Platinum has continues to display weakness as it dropped $18.20 on the week to close at $1222.50. Despite being up on the week at the close on Thursday, the $30 sell off on Friday put the metal back in negative territory. After spending the past few weeks above the 50 day MA, the weakness brought the metal back down to the trend line, which it has been riding the past two weeks. Palladium continues to bounce off the $800 as sellers keep the metal below $800 at $783.80 to close the week.
Technicals:
- Support: $1,184.50
- Resistance: $1,271.30
- 50 day moving average: $1,229.55
- 200 day moving average: $1,349.72

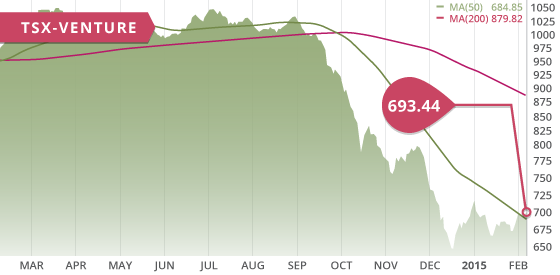
The TSX had a strong week as it was up over 400 points to close at 15083.92, up 2.8%. This was the highest close since the high reached on November 21st, which marked the last day of a failed rally off of the October 16th low. If this current rally off of the December 15th lows continues, then the TSX will be eyeing the all-time high of 15685.13 put in on September 3rd of 2014. Perhaps it will take some miners up with it. The TSX Venture was up a modest 16.63 points on the week, and in the process broke above the 50 day MA for the first time since early September. The exchange closed the week up 2.5% at 693.44, and is now up 8% since the all-time low put in on December 17th.
A stronger U.S. dollar weighed on the commodity sector, especially the precious metals sector. Of particular influence, was the strong jobs numbers out of the U.S., increasing near-term rate hike expectations and in turn removing the attractiveness of gold in a low rate environment. Data released last week showed American oil inventories at the largest in 80 years, however the US oil and gas rig count has also dropped for the 9th straight week to lows not seen since 2010.
A Look Ahead
As we keep an eye on economies around the world, particularly on the recovery of the US, the condition of the Euro Area, and the growth in China, the key economic items on the calendar this upcoming week are:
Sunday Feb. 8
– Balance of Trade (CHN) – Consensus: $48.9B
Monday Feb. 9
– GDP Growth Rate (IND) – Consensus: 5.5%
– Balance of Trade (IND) – Prior: $-9.43B
– Balance of Trade (RUS) – Consensus: $9.9B
Tuesday Feb. 10
– Inflation Rate (CHN) – Consensus: 1.0%
Thursday Feb. 12
– Initial Jobless Claims (US) – Consensus: 285K
– Retail Sales MoM (US) – Consensus: -0.5%
– RBA’s Governor Speech (AUS)
Friday Feb. 13
– GDP Growth Rate Q4 Flash QoQ (EA) – Consensus: 0.2%
– MI Consumer Sentiment Prelim. (US) – Consensus: 97.3
This week is a fairly quiet one. We will see GDP growth and Balance of Trade out of India, a large consumer of materials. We will see the impacts of sanctions on Russian GDP, and if consensus turn out to be accurate, it would be Russia’s lowest surplus since 2009. With the weak exports in the U.S. over the past two months, the market will be looking closely at the retail sales data out on Thursday. The market will use these number to forecast U.S. GDP, and a weak reading would apply considerable pressure on the U.S. dollar. Initial jobless claims will be important to confirm this weeks positive jobs numbers or on the other hand determine if they were in fact just a one-off. Further confirmation of strong jobs growth will continues to increase the prospect of a June rate hike, and therefore continues to put pressure on gold.
Last Week: In keeping with the times of central bank accommodative policies, the RBA cut its benchmark interest rate by a quarter percentage point to 2.25%. The Governor of the RBA will speek on Thursday to offer clarity about Australia’s direction in monetary policy. A weaker Australian dollar supports a stronger U.S. dollar which is inversely negative to gold. The central banks of four of the major currencies; Yen, Euro, Canadian Dollar, Australian Dollar, have all taken accommodative measures that have resulted in the weakening of their respective currencies.
In the U.S. the non-farm payroll data was better then expected despite mixed jobs numbers earlier in the week, with ADP numbers showing lower job gains then expected and the Challenger report showing more corporate layoffs then estimated, yet the initial jobless claims were less then expected. Wage growth in the U.S. increased in January. This number will be heavily scrutinized by the FOMC, as well as the market, to determine the health of the employment picture in the U.S., and in turn the potential date of the Fed’s looming rate hike. The balance of trade data out of the U.S. showed another month of weak exports, an indication if the impacts of the stronger dollar and impact of GDP.
Canadian Trade Balance was much better than expected which gave a boost to the Canadian dollar on Thursday. The Ivey PMI in Canada fell well below expectations indicating a drop in business confidence within the country.

Mexico developers will be released within the next week or two as we are currently working through the numbers.
Top 10 Updates:
Dalradian Resources DNA.TO announced this week additions to their management team as they look towards development at Curraghinalt and begin building their mine team.

- Symbol: RPM.V
- Price: $0.13
- Shares Outstanding: 146,446,746
- Market Cap: $19,038,077
- Cash: $5.6 million CDN (as of Sept. 30th)
- Significant shareholders: Sun Valley Gold LLC (13%)
Rye Patch Gold (RPM.V) is a gold exploration company with a number of projects in Nevada. The company is in a healthy financial position with over $5 million in cash, no debt, and next to no liabilities. The share count is fairly high for a junior at this stage but their annual income should mitigate any significant dilution in the foreseeable future. This is due to the fact that the company is generating income from their 3.4% NSR royalty on Coeur Mining’s Rochester Mine. This royalty, which commenced January 1st of 2014, will pay the company roughly $4-$8 million annually for the next few years depending on the metal price. These funds will allow the company to survive through this downturn and continue developing their Nevada assets in the mean time.
The company holds a handful of projects in Nevada with their primary focus being on the Lincoln Hill Project located within the Oreana Trend. This project contains a modest (M&I) resource of 568,940 gold equivalent ounce at a grade of 0.61 g/t AuEq, as well as inferred resources of 418,260 gold equivalent ounces at a grade of 0.69 g/t AuEq. The Lincoln Hill deposit is a near to at surface deposit orientated on a hill side, a situation supportive of the economics of the deposit. The company produced a PEA on the project which displayed positive economics in a $1350 gold environment. This would be a small 5-year operation consisting exclusively of heap leach operations. The initial CapEx would be a very manageable $26 million, with $4 million in sustaining capital over the 5 year life of mine. The economics are supported by a impressively low strip ratio of 0.54:1, and displayed an after-tax NPV5% of $40.9 million with an IRR of 53% and a payback of 1.6 years. Any expansion of the resource, or the discovery/development of satellite deposits, would greatly add to the mine life of this low-cost project.
Like the Lincoln Hill Project, the company’s Wilco Project is also located in the Oreana Trend, less then 2 km west of the Lincoln Hill. The Wilco Project contains a low-grade (M&I) resource of 1.5 million gold equivalent ounces at a grade of 0.41 g/t AuEq, as well as inferred resource of 663,000 gold equivalent ounces at a grade of 0.39 g/t AuEq. Although this resource is low-grade and will need much higher metal prices to become economic on a stand alone basis, the proximity to Lincoln Hill may provide a boost to economics and mine life of Lincoln Hill.
The company also holds properties within in the prolific Cortez Trend. These properties are contiguous to Barrick Gold’s large land package which has had over 50 million ounces discovered on the property. It is the company’s hope that they can indentify the extension of Barrick 15 million ounce Goldrush deposit, since both the Garden Gate and Patty projects are along strike of the Goldrush deposit. In drilling the Golden Gate property, the company is attempting to find the extension of the Goldrush deposit along strike. Meanwhile, the Patty Project is under a JV agreement with Barrick and McEwen Mining, and the focus is on making a new discovery there. Rye Patch will be back on the drill in the spring of 2015 to test out their theories as well as attempt to make a new discovery.
Bottom line
We like this company because of its healthy financial position, and the fact that it holds advanced stage projects in a stable-mining friendly jurisdiction. In a period where financing is hard to come by for junior exploration companies, Rye Patch is in a enviable position with their royalty agreement. This annual income will allow the company to develop their properties without having to incur significant share dilution in the process. The company is run by an experienced CEO with a number of notable projects that he has contributed to. The addition of Randy Buffington in 2014 has also greatly strengthened the board.
The continuous development of their projects over the next few years will position the company well once the gold sector begins its next bull cycle. It is too early to know if the company will be successful identifying an extension of Barrick’s Goldrush deposit, or if Lincoln Hill will ever become a mine. However, the company is well funded to advance their projects and find out. With majors such as Barrick holding prolific and contiguous claims to Rye Patch properties, any positive discoveries by the company could lead to positive attention by these majors, which in turn will be positive for the share price.
Potential Catalysts and Events to Monitor:
- Drilling on all five of their Projects: Expansion, Infill, and Discovery Drilling (2015)
- 2015 Royalty Payments

FEB


