
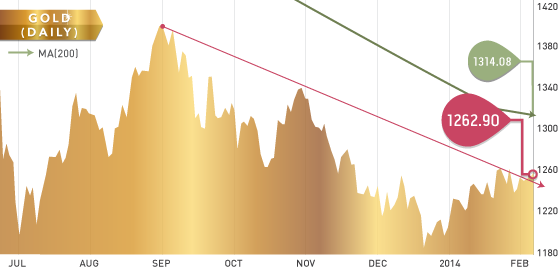
Gold and silver finished up 2% and 4.5% respectively this week, while platinum and palladium finished slightly higher. The U.S. dollar was very soft against other currencies all week, which added assistance to moving the precious metals higher. Gold has put in four short-term tops around $1262-$1265 on an hourly chart. This has created a small ascending triangle pattern and a follow through of this pattern leads to a measured move up to $1280. Without getting too far ahead of ourselves, a break of $1280 would create a breakout above the long-term downtrend that gold has been in since the beginning of Q4 2013. The first resistance point is the 200-day moving average of $1315.
Silver’s chart does not look as interesting from a technical perspective. Silver has been range bound since mid-November and will remain that way until it closes above $20.50 or below $19. If we were to get a breakout in gold, we would likely see a quick move in silver above the $20.50 level and up into the 200-day moving average of 21.24.
Gold Chart 2014

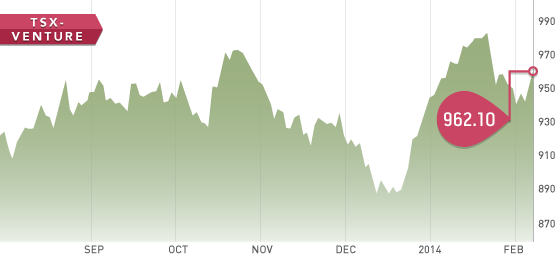
After a steep drop across the board on Monday, all the indices consolidated and closed the week with two positive days. The TSX-V opened the week at 951, so while it was an ugly start the result is another net positive week for the Venture. South Africa’s Association of Mineworkers and Construction Union rejected a 9 percent wage increase offer on Thursday from leading platinum producers, which is prolonging a week of industrial action. The strike is currently affecting around 40 percent of the global supply of platinum.
Taking a look at the GDX and GDXJ fund flows (net change in funds buying / selling), the flow of funds is positive and at the highest levels for the year. This is important because positive money flow represents relative strength. In comparison, the SPY has negative fund flows and exhibits relative weakness.
TSX-V Chart 2014
Headline of the Week
Headline of the Week belongs to Gold Resource Corporation (GORO). In a world where money is tight and everyone is trying to cut costs, GORO is doing just the opposite! They decided to increase top management salaries to $600,000, $350,000, and $250,000. When you’ve lost two-thirds of your market cap ($500 million) in a year, relative to the $93 million in dividends you have paid out (over 3 years), you should not be rewarding management.
A Look Ahead
Next Tuesday and Thursday, Janet ‘Helicopter’ Yellen takes the stage for her first test since coming In as head of the U.S. Federal Reserve. On Friday, the European Q4 GDP and annual GDP numbers will be released, which will give investors a good look at what is going on across the pond.
Inside the Database
We spent most of the week working on developing the “Great White North” section of the database, which includes Alaska and the northern provinces of Canada (Yukon, Nunavut, and North West Territories).
There are 27 companies in the exploration section and if we had to describe them in one word, it would be “yikes”. On first glance there are not to many “on the cusp” companies; they are either rock solid, or solidly awful. We are also seeing a lot of companies that are in total hibernation mode, which can likely be attributed to the low gold price as well as the inability to do a lot of work up north at this time of year.
Analyst portfolio performance: The analyst portfolio continues to outperform. The average return of all ten stocks is +25% while our top five are +39% YTD.

 Symbol: NFR.V
Share Price: $0.04
Shares O/S: 152,334,884
Market Cap: $6,093,000
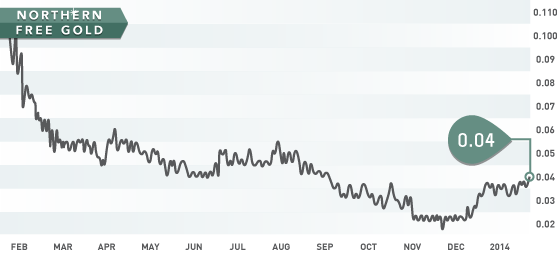
This week we take a look at a development company in the Yukon: Northern Freegold. Northern Freegold has been stuck in the $0.02-$0.04 range for the last three months, but has tremendous leverage to the gold price. A PEA was completed in 2013 and showed a 23.4% IRR using $1455 gold, $27.55 silver, and $3.65 copper. The plan is for it to be an open pit mine, which keeps the CAPEX fairly reasonable at $500 million. Financials at the end of September showed a cash position of $1,137,736. With $1 million in the bank it is unlikely they will need to finance until mid to late 2014.
Several members of the management and board own over one million shares so interests are well aligned with shareholders. The plan for 2014 includes further drilling and metallurgical testing. Looking at the current valuation this could be a cheap takeover target and we could see the stock price double or triple if the gold market picks up in 2014
Northern Freegold 1 Year Chart
FEB


