
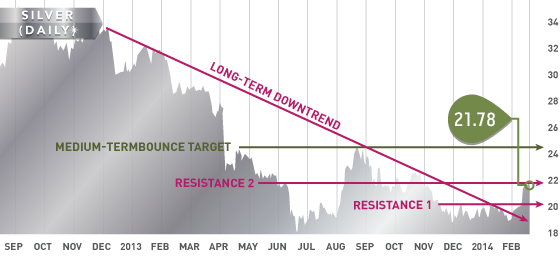
The precious metals recovered on Thursday and Friday from three initial weak days to close in positive territory for the week; silver led the charge finishing up over 1%. The 200-day moving average has worked well as a “catch play” near the $1,305-$1,310 level, while silver has spent several days consolidating in an upper flag patter near $22. Next week, $1,310/$1,290 and $20.50/$21.25 are support points for gold and silver, respectively. Gold has room to run up to $1,350-$1,360 and a break above $22 in silver could get a move going up to $22.50-$22.80.
Another potential catalyst for gold moving forward is the relaxation on gold imports into India. India is one of the major players in the physical markets, which could be an important catalyst moving forward.
Silver Chart

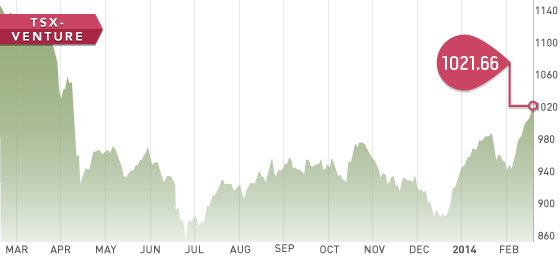
The TSX-V enjoyed another solid week of gains, pushing up above the 1,000 level for the first time since April, 2013. The TSX-Gold index also posted solid numbers moving up to the 205 level, a level not seen since August 2013.
TSX-V Chart
Headline of the Week
Headline of the week goes to Eldorado Gold for their Q4 write-downs totalling over $800 million! We dove a little deeper and came up with a few interesting stats on ELD and maybe they are not as bad as the write down suggests. Their all-in costs, excluding the write down, averaged $1,050 for the year and in Q4 their all-in costs were $1,082. Forecasted production for 2014 is 730,000-800,000 ounces, which is roughly an increase of 1%-10%.
A Look Ahead
Next week there are several major international economic events. On Monday we have Eurozone CPI, Thursday is U.S. Durable goods, Janet Yellen’s speech and Japanese CPI, and Friday is Canadian and U.S. GDP. These are important events next week because all of them have the ability to significantly move the USD as well as provide additional insight on the economic climate.
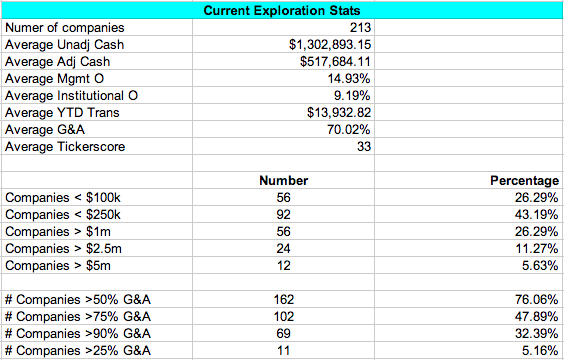
Inside the Database
Next week we will be rolling out an excel file that subscribers can download and play around with. It will allow you to populate lists of exploration or development companies across different regions according to variables you specify. For now, we have attached a screenshot of our current exploration stats.
Analyst portfolio performance: Year-to-Date return from all 10 analyst picks: 40.5%; Top 5 picks: 55.3%; Total return in February is 16.2%.

 Symbol: TCM.T
Share price: $3.21
Share O/S: 171,452,069
Market Cap: $505,784,000
FEB


