
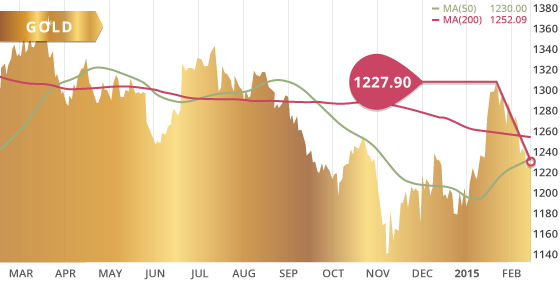
Gold
Gold continued its downward momentum last week, though it did experience a minor bounce off of the $1216.50 level on Thursday and Friday. Thanks to the bounce off of the 5-week low, gold was able to pare back some of the losses earlier in the week. The metal closed Friday’s session at $1227.90, down a mere $5.40 on the week. Gold found support along the 100 day MA at $1216.50 on Wednesday and the trend line also held up the following day. Near-term this trend line looks to offer support, which also coincides with a 50% retracement area of gold’s run-up from the low of early November to the high in January. Near-term resistance has now moved down to $1246.84 with the declining 200 day MA potentially providing further resistance around the $1250 level.
The World Gold Council released their Q4 and full year 2014 Gold Demand Trends report last week. The report showed Central Banks bought 477.2 tonnes of gold in 2014, the second highest in 50 years, next to 2012. Of the central banks, Russia was the largest buyer of 173 tonnes, accounting for 36% of the central bank total. Technology use of was an 11-year low at 389 tonnes, while investment demand rose 2% to 904.6 tonnes and jewelery was 5% above its 5-year average. The total demand for gold in 2014 totalled 3,923.7 tonnes. Total supply was flat, with mine production at a record 3,114.4 tonnes in 2014, although offset by a decline in recycling to a 7-year low, both totalling 4,278.2 tonnes. The report stated that growth in mine production is likely to diminish going forward as the development pipeline thins and mine production plateaus over the next couple of years. This scenario bodes well for companies with attractive development projects in safe jurisdictions with efficient permitting.
Technicals:
- Support: $1216.92
- Resistance: $1,246.85
- 50 day moving average: $1,230.00
- 200 day moving average: $1,252.09
- HUI/Gold Ratio: 0.156 (Last week 0.156)
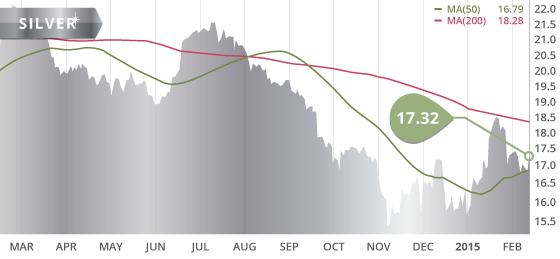
Silver
Silver was up on the week thanks to a strong surge on Friday. The metal closed Friday’s session at $17.32, up $0.61 or 3.7% on the week. Silver found support all of last week along the 50 day MA, with the $16.55 level holding once again. Solid long-term support remains at $15.48, near-term however, $16.55 is appearing to strengthen as a level of support. A break above the $17.76 level will have the metal looking toward solid resistance at $18.50.
Technicals:
- Support: $16.55
- Resistance: $17.76
- 50 day moving average: $16.79
- 200 day moving average: $18.28
- Gold/Silver Ratio: 70.89
XAU/Gold Ratio: 0.0628 (Last Week: 0.0624)
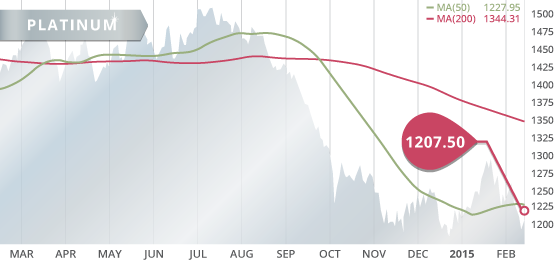
Platinum
Platinum continued its descent as it traded below $1200 during the week for the first time since early January. The metal regained some ground on Thursday and Friday to close back above $1200, although only slightly at $1207.50, down 1.2% on the week. With the global economic growth picture deteriorating, we may see the $1184 support level tested in the coming week or two.
Technicals:
- Support: $1,184.50
- Resistance: $1,225.70
- 50 day moving average: $1,227.95
- 200 day moving average: $1,344.31

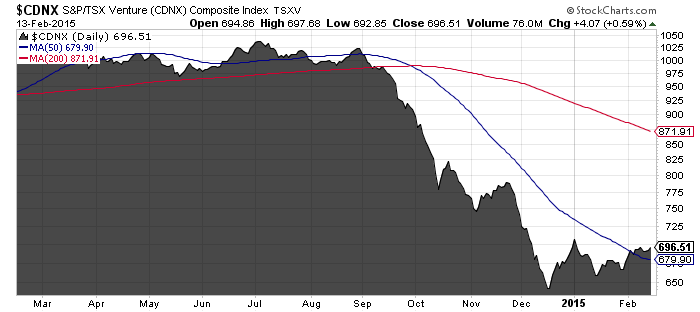
The TSX continued its month long ascent by gaining 180.89 points on the week to close at 15264.81, up 1.2% on the week. The Venture Exchange traded sideways all week and closed essentially flat at 696.51, up a mere 3.07 points while remaining above the 50 day moving average.
A Look Ahead
As we keep an eye on economies around the world, particularly on the recovery of the US, the condition of the Euro Area, and the growth in China, the key economic items on the calendar this upcoming week are:
Sunday Feb. 15
– GDP QoQ, YoY (JPN) – Consensus: 3.7%, 0.9%
Monday Feb. 16
– Trade Balance (EA) – Consensus: €20.5B
Tuesday Feb. 17
– German ZEW Economic Sentiment (EA) – Consensus: 56.0
Wednesday Feb. 18
– BOJ Press Conference
– Building Permits (US) – Consensus: 1.07M
– Housing Starts (US) – Consensus: 1.07M
– Industrial production MoM (US) – Consensus: 0.3%
– PPI MoM (US) – Consensus: -0.4%
– FOMC Minutes
Thursday Feb. 19
– Initial Jobless Claims (US) – Consensus: 292K
– Philly Fed Manufacturing Index (US) – Consensus: 10.0
– Consumer Confidence (EA) – Consensus: -7.5
Friday Feb. 20
– Markit Manufacturing PMI (US) – Consensus: 53.8
– Core Retail Sales (CAN) – Consensus: -0.7%
The main items the market will watch this week will be the FOMC Minutes, Bank of Japan press conference, as well as the building permits and Philly Fed Manufacturing Index. Wednesday and Thursday could potentially be volatile days for markets and in particularly gold.

We continue to work on Mexico Developers which we anticipate will be released within the next week or two.
Nevada Development was delayed but will be released very shortly (2-3 days)


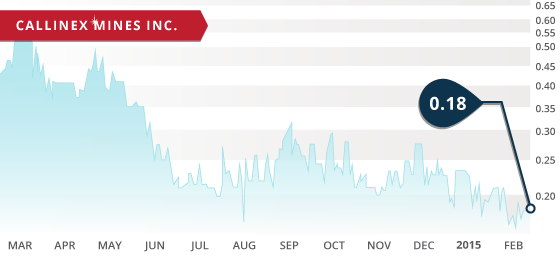
- Symbol: CNX.V
- Price: $0.18
- Shares Outstanding: 32,056,101
- Market Cap: $5.77 Million
- Cash: $961,000 CDN
- Significant shareholders: Management (4.5%)
Callinex Mines (CNX.V) is an explorer searching for VMS deposits in the prolific Flin Flon mining district of Manitoba Canada. Callinex was spun out from Callinan Mines in 2011, as Callinan wanted to become a royalty company and reorganize its exploration assets into a separate company (Callinex). Callinex holds a number of exploration projects in Manitoba, as well as their Coles Creek polymetallic project in BC. Manitoba is a stable mining jurisdiction with exploration incentives, and has been ranked 10th globally for mining practices by the Fraser Institute.
Ex-Callinan President and CEO Mike Muzylowski is now the Chairman for Callinex. Mr. Muzylowski has over 50 years of mining experience, playing a lead role in the discover and/or development of 16 mines. He has also been inducted into the Canadian Mining Hall of Fame, as well as was a recipient of the PDAC Developer of the Year Award. The Company went through a significant overhaul in management during 2014, with a new CEO, new CFO, new directors, and a new advisory board. This new team will provide a new direction and focus for the company, as well as access to capital markets.
The company’s main focus has turned to their Pine Bay Project and their Flin Flon Project. Both projects are located in the Flin Flon District and are surrounded by Hudbay Minerals (HBM.TO) claims, as well as multiple VMS deposits and producing/historic mines. Hudbay has operated in the Flin Flon District for over 85 years, mining 145 million tonnes of ore in that timeframe. In the town of Flin Flon, Hudbay operates their flagship 777 mine as well as an ore concentrator and zinc production facilities. The proximity of Callinex’s Pine Bay and Flin Flon projects to Hudbay’s processing facilities makes any notable discovery by Callinex particularly valuable. At this point, the processing facilities will require additional ore in the next 4-5 years. For this reason Hudbay has budgeted $20 million in exploration for 2015 in attempts to expand their existing deposits. Therefore, any significant discovery made by Callinex would surely grab Hudbay’s attention.
Callinex has recently announced a fully funded two-phase drill program focused on the Pine Bay and Flin Flon Projects. Phase-one will commence at some point in the next 30 days, and will consist of 2000 meters primarily focused on expanding the high-grade mineralization at Pine Bay. The Pine Bay Project contains a historical resource that the company hopes to verify in the upcoming drill program as well a subsequent drilling.
Bottom line
The company is run by a strong team including Chairman Mike Muzylowski, a renowned geologist who has contributed to a number of notable discovery/development projects in his over 50 years of experience. The company has a tight share structure and a conservative burn rate, which is extremely important during these times of parched capital markets. As the company develops their projects further, they will need to raise additional funds, though if company is successful with this year’s drill program, the impact on the share price may generate a less dilutive condition to raise money. This is an early stage exploration company exploring in a prolific district area with proven mineralization, as well as host to current and past producing mines. As VMS deposits typically occur in clusters, Callinex has an increased probability of discovering economic deposits in addition to the multitude already discovered in the Flin Flon District. With shares trading at $0.18 and a market cap under $6 million, a successful 2015 drill program could surely add value to the company and increase those numbers.
Potential Catalysts and Events to Monitor:
- Pine Bay and Flin Flon phase-one drilling (Q1-Q2 2015)
- Pine Bay and Flin Flon phase-two drilling (Q3 2015)
FEB


