
Gold finished off a strong week at $1222.20, up 2.5%. This was a continuation of its recent rally off of the November low of $1131.
On Tuesday, gold broke through a four month down-trend line with conviction, though it encountered resistance at a 50% retracement mark at the $1238 level. This resistance mark also coincided with a test of a stronger five month down-trend line from the July highs. A break above this level would have gold looking to test a cluster of resistance marks at around the $1260 level. If gold could break above $1260 it would be in free territory to test solid resistance at the $1320 level.
While things look bearish from a long term perspective, this initial strength is a good sign. However, gold does need to break the downtrend line to confirm that this rally is not merely a dead cat bounce. The FOMC conclusion on Wednesday could prove to be the catalyst for such a test.
With the inflation picture not improving in the US, it will be interesting to see what comes out of the FOMC meeting. There are indications that the market is pricing in long-term low inflation, which if correct, is not a positive sign for a recovering economy. The weakness in the USD and the US markets last week may be a sign of what’s to come.
Technicals:
- Support: $1,186
- Resistance: $1,238.25
- 50 day moving average: $1,203.49
- 200 day moving average: $1,257.43
- HUI/Gold Ratio: 0.135 (Last week 0.139)

Silver
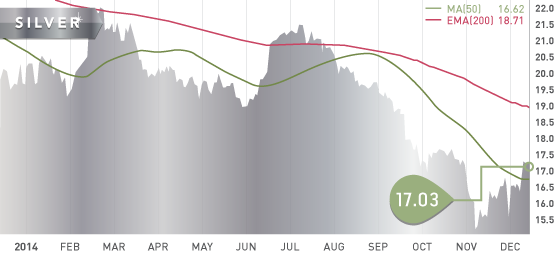
Silver made a strong move on Tuesday gaining close to 4.5% on the day, and broke through both the 50 day moving average as well as the five-month trend line with conviction. In follow-through buying on Wednesday, Silver hit a six week high of $17.30 before pulling back to end the week at $17.03. Silver is now up 10% over the past two weeks. The metal is now looking towards testing resistance at the $17.80 level.
Technicals:
- Support: $16.04
- Resistance: $17.80
- 50 day moving average: $16.62
- 200 day moving average: $18.71
- Silver/Gold Ratio: 71.76
- XAU/Gold Ratio: 0.0562 (Last Week: 0.0588)
Platinum
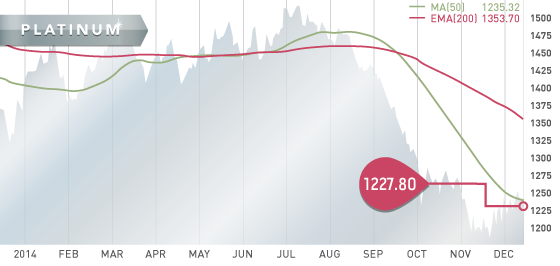
Platinum finished the week up slightly. Although it ended up finishing below the 50 day moving average, it did close above it three days of the week. This is the first time this has happened since August.
On Tuesday platinum advanced towards the $1260 level but bounced off and pulled back for the rest of the week. The metal is slowly picking itself off the floor after its 22% collapse from the July highs.
Technicals:
- Support: $1,186
- Resistance: $1,260
- 50 day moving average: $1,235.32
- 200 day moving average: $1,353.70

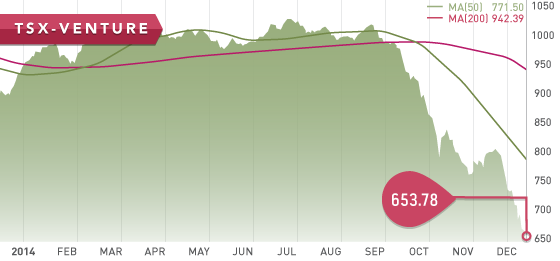
The TSX was down 300+ points to open the week after weak Chinese trade data was released early Monday. The weak data pushed down the price of oil as well as base metals. After a small bounce on Tuesday the TSX was down once again over 400 points at one point on Wednesday, finally finishing the day down 342 points. This was after OPEC cut its forecast for 2015 demand, and also stated that supply will rise more than forecast next year. This had oil dropping after the news, as well as the TSX energy sector, which is now down 40% since June.
Despite gold and silver both finishing up on the week, the Venture continued its sell-off. This was aided by the collapsing oil price and falling Canadian dollar, both factors in the “sell Canada” theme currently impacting both the TSX and the TSX-V. The TSX fell 5% on the week, its largest one week decline in 3 years, and the TSX-V was down 6.8%.
The combination of disappointing Chinese data and oil hitting a five year low of $57.71 on Friday have both hit the Canadian resource sector hard. The Canadian dollar hit a 5 ½ year low of 86.5 cents against the US dollar this week .
A Look Ahead
As we keep an eye on economies around the world, particularly on the recovery of the US, the condition of the Euro Area, and the growth in China, the key economic items on the calendar this upcoming week are:
Sunday Dec. 14
– Parliamentary Elections (JPN) – Consensus: PM Abe victory
Monday Dec. 15
– Industrial Production MoM (US) – Consensus: 0.6%
Tuesday Dec. 16
– Building Permits and Starts (US) – Consensus: 1060K, 1040K
– Manufacturing PMI (US) – Consensus: 56.4
– Balance of Trade (JPN) – Consensus: ¥-1000B
Wednesday Dec. 17
– Core Inflation Rate (US) – Consensus: 1.8%
– Inflation Rate Mom, Yoy (US) – Consensus: -0.1%, 1.4%
– FOMC Meeting and Rate Decision (US)
Thursday Dec. 18
– Initial Jobless Claims (US) – Consensus: 299K
– Composite, Services PMI Flash (US) – Forecast: 55.5, 56.6
Friday Dec. 19
– Core Inflation (CAN) – Consensus: 2.5%
– Inflation Rate MoM, YoY (CAN) – Consensus: -0.1%, 2.3%
It is a mixed bag this week with the main focus being on the two-day FOMC meeting that wraps up on Wednesday. There will be a Summary of Economic Projections followed by a press conference by Yellen. The market will be watching closely for confirmation of a recovering economy as well as for any clues as to the timing and magnitude of expected rate hikes in 2015. Earlier the same day, much anticipated inflation numbers for the US will also be released. On Friday we will see the inflation numbers for Canada, which could help the Loonie find some ground after the current oil-induced sell off.
Last Week: Chinas exports grew by 4.7% with a big jump in volume to the EU. November data out of Japan and China were disappointing this week and pointed to slowing economies. This is especially the case in Japan where it appears the recession is worse than estimated. Data showed GDP contracting more than expected in both the third quarter as well as annually. However, Japans manufacturing growth beat expectations.
Industrial production numbers for China fell short of estimates and showed that manufacturing growth slowed once again in November.
Initial jobless claims in the US were in line with expectations, however the continuing jobless claims rose more than expected. US retail sales topped expectations which gave some strength to an otherwise softer dollar this week.

This week Mexico Silver Producers update will be released, with some bigger names suffering amidst a low silver price. Taking the top two spots on the list are SilverCrest and Fortuna Silver. Both of theses companies have healthy balance sheets and have both generated positive earnings in the third quarter. We are now working on Nevada Developers and Explorers.
This week the Tickerscores team will make our final selections for our Top 10 report, which we anticipate will be out at the beginning of January.

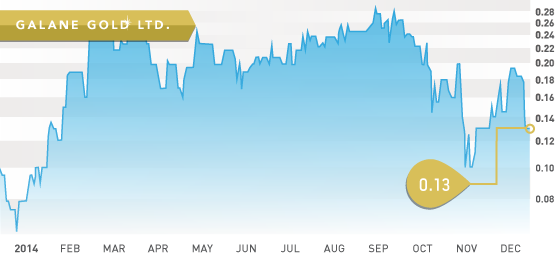
![]()
- Symbol: GG.V
- Price: $0.13
- Shares Outstanding: 52,677,458
- Market Cap: $ 6.8 million
- Cash: $12 million (As of Sept. 30)
- Significant shareholders: IAMGold Corp. (41.5%), Sprott Asset Management (8.9%), Management and Directors (16.7%)
Note: Galane was ranked number one in our Africa Producers category.
Galane Gold (GG.V) is a small gold producer with operations in the African country of Botswana. We have chosen Galane as stock of the week in large part due to the discrepancy between its cash position ($12 million USD) and its market capitalization ($7 million CDN). This discrepancy gives little value to their Mupane assets (property, plant, and equipment), or to their production ($0.02 earnings/share year to date). Galane has a respectable $18.5 million in liabilities and $46.5 million in assets. Of their liabilities, $8.7 million is in interest-bearing loans. If we were to take the difference between Galane’s cash position and the loan debt, it would equal $0.07/share in remaining cash ($ 3.8 million CDN). With Galane generating $0.02/share in earnings year to date and looking to improve on that number, it seems hard to imagine the share price remaining at these levels.
Management is well-aligned with shareholders, holding close to 17% of the shares. The company is also in strong hands, with IAMGOLD (IMG.TO) holding 42.5% of the company. Galane has a sound management team with past experience with the Mupane project. Charles Byron is the Chief Geologist and Director for Galane, and was responsible for the discovery of the Mupane Gold Deposit and subsequently seeing it into production in 2004.
Mupane Gold Mine
The Mupane gold mine is a past producing mine with historical production of 615,000 ounces of gold. The property was acquired from IAMGOLD in 2011 with the goal of achieving a consistent 50,000 ounces of annual production. Galane is on pace to produce around 35,000 ounces this year, although this is well shy of their 50,000 target. However, Galane had some unfortunate issues this year with their processing equipment. Their SAG mill motor failed in May, which was subsequently replaced by an emergency motor having 70% of normal capacity. This in turn impacted their output and decreased their gold production during both the second and third quarter. This was an unfortunate setback after improvements in production were being realized since mid-2013. Galane has produced just over 25,000 ounces of gold in the three quarters of 2014, at a fully loaded cost of $1271 an ounce. That fully loaded costs would be around $1100 had the mill motor not failed and caused a drop in production during the three months in Q2 and Q3. Galane should be back to normal output now that a new mill motor was installed in September, and back to positive quarterly earnings.
The project consists of multiple deposits feeding a central processing facility, with a number of deposits in the pipeline to provide future mill feed. The aggregate resource of these multiple deposits is 507,900 measured and indicated ounces of gold, and 261,000 inferred ounces. There are also numerous untested targets that the company had identified through gold-in-soil anomalies, which they will follow up with drilling in the future. The Galane team completed a comprehensive 5-year mine plan late last year, which enables them to remain flexible in a changing gold price environment. The company will therefore “adopt the appropriate (mine) plan for the prevailing gold price”.
Bottom line
The market cap of the company does not reflect the value of cash on hand, the assets of the company, and the earnings achieved this year. Galane had brought down their fully loaded costs to $1100 an ounce in Q3, and looks to maintain that number, and generate positive earnings at the current gold price. Perhaps there is some sell-off due to the tax-loss season, and perhaps investors are shying away from African gold plays with the recent Burkina Faso uprising, and the Ebola outbreak in Western Africa. Botswana however, is a stable democratic country, being ranked by the World Bank as the best investment jurisdiction in Africa, and ranked 25th by the Fraser Institute on mining policy. Also, both South Africa and Botswana have not had any reported Ebola cases in their respective countries.
The company holds a large land position which has the potential to identify new deposits of future mill feed. The free cash flow generated by the operations enables the company to fund their continuing exploration activities without having to dilute their otherwise conservative share count.
Potential Catalysts and Events to Monitor:
- Increased Production
- Lower cost Mining
- Exploration Potential
Note: Galane is a thinly traded stock, so one should be patient and selective with their bids.
DEC


