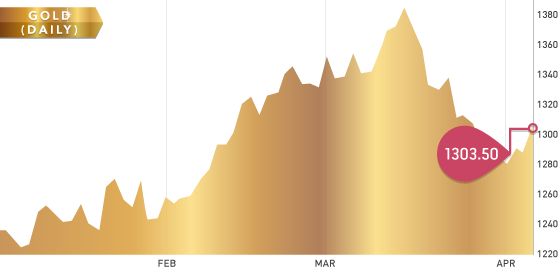
Gold finished the week at $1,303.50, up $9.70 from last week’s close at $1,293.80. It was a relatively quiet week as traders awaited the U.S. jobs data on Friday. Non-farm payrolls came in at 192,000 new jobs last month, which was below the expected 200,000. The unemployment rate was unchanged at 6.7%. The lower than expected data gave gold a positive boost up over $16/oz on Friday. Physical demand in China fell in the month of March due in part to a weakness in the Yuan.
Gold Chart
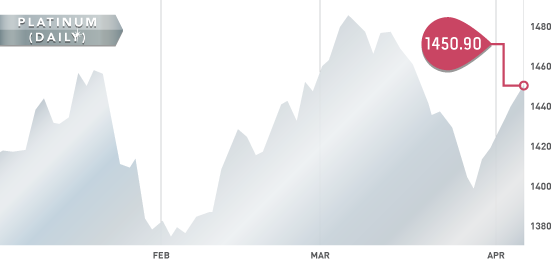
The turmoil in South Africa continues as platinum strikes continue to mount and is starting to affect the economy. Losses have now totalled over 550,000 ounces, which surpasses the levels of the 2012 strike. The strike has lasted for 10 weeks now with neither side willing to budge on the negotiation front. The Association of Mineworkers and Construction Unions (AMCU) is demanding the equivalent of a 25% raise per year over the next four years. Platinum producers are countering with an offer of 9% saying anything higher would be unaffordable. Each day the strike continues, an estimated ~R67 million goes unspent on goods and services, which is a direct loss to the overall economy.
Gold Chart
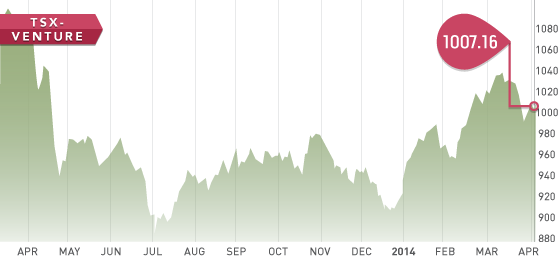
The TSX Venture opened the week at 989.75 and closed at 1007.16. The volume on the TSX Venture continues to be weak with most days being in the 65-75 million range. If you are looking at investing in TSX Venture stocks at this time make sure you check the balance sheet. Remember, “sell in May and go away” is only four weeks away.
The TSX continues to roll along and is close to six-year highs, nearing levels reached in May 2008.
The marijuana frenzy continues with Tweed (TWD.V) listing today and trading over 10 million shares. In our opinion, this continues to be a bubble and you will only see a select few of these companies around in six months.
TSX-V Chart
A Look Ahead
The key items on the calendar next week are:
• FOMC minutes – April 9th
• Federal budget for March – April 10th
We released our Tickerscores Top 10 report this week. Countless hours of research and hard work was put into this report and we hope you enjoy it! You can view it here (note: this is only available to paying subscribers).
Next on the agenda is updating Tickerscores companies with data from audited annual financial statements. We will be tackling all producers first, starting off with African gold companies.
Analyst portfolio performance: Year to date performance is still very strong at 23.71%.
 Symbol: PG.T
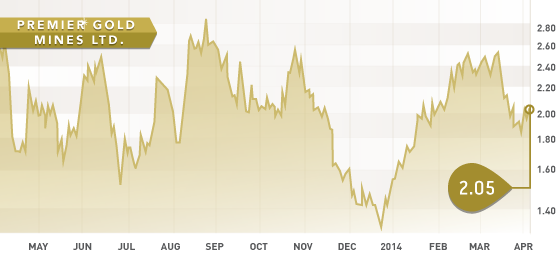
Price: $2.05
Shares Outstanding: 151,496,475
Market Cap: $298,448,000
Cash: ~$65 million
This week we feature Premier Gold Mines, a gold development company with excellent projects in safe jurisdictions. Premier has an experienced management team with a strong history in the mining sector. Three excellent projects are the core focus of the project portfolio. The Trans-Canada project in Ontario has district-scale potential and already hosts four deposits. It is hard to find any project in the world that is more strategically located to infrastructure. The project is literally right beside the Trans-Canada highway.
A PEA has been completed at the Hardrock project, which is the most advanced of the four. The production metrics from the PEA look robust with 3 million ounces being produced over 15 years with a pre-production CAPEX of only $410 million. At $1,250 gold, Premier is looking at a 23% IRR and a 3.5-year payback period.
The Cove project in Nevada is a high-grade gold project with Premier trying to prove up gold ounces in proximity or under the past producing Cove pit. The enterprise value per ounce of Premier is ~$30, which ranks in the bottom quartile among its peers. With $65 million in cash, Premier is well funded to move all three projects forward and create shareholder value.
APR


