
Gold
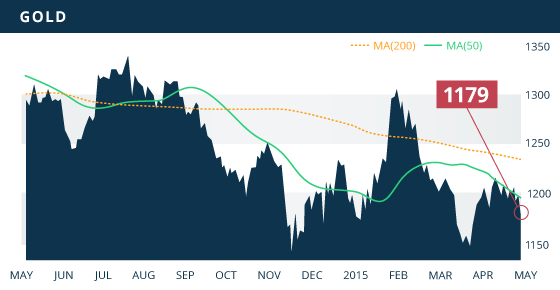
After lingering above the $1185 support level for most of last week, gold finally broke through this level with sustained selling pressure that pushed the metal all the way to $1175. It then regained some ground and closed at a 5-week low of $1179.90, down $23.90 or 2% on the week. The main drivers behind the selloff on Friday appears to have been the strong gains in U.S. equities and the better than expected earnings from the Tech sector. These factors had investors selling gold and into U.S. equities as economic risk continues to wane.
There are a number of persuasive economic events occurring this week, chiefly the two-day FOMC meeting ending on Wednesday, as well as possible implications from the Bank of Japan press conference during Asian trading early Thursday morning. In addition to these two events, there is a number of economic data points out this week that the market will look at to help form their rate-hike expectations.
Gold may find support along a broken trend line declining from the January highs. If obeyed, gold should remain above $1160 level. However, if this trend line fails as support, there is an ascending trend line from the November low that will provide solid support around the $1151 area. Keep an eye on $1150 as a drop below this mark will have gold eyeing the November low. Short-term resistance is around the $1200 area, with the metal obeying a 3-month trend line from the January highs. A close above the $1200 this week would be encouraging for the metal, and break out up through the 100 day MA in the $1211 area would be show there is still strength left in the metal. However, at this point it will require a significant catalyst.
Above $1200, solid resistance is in place around the $1225 area. The metal has also been riding the 50 day MA for the entire month of April. If this correlation holds up, we will see the metal continue to fall alongside the declining trend line. The U.S. dollar index is off 2.5% over the past 2 weeks, yet gold has essentially mimicked the performance of the dollar by falling 2.3% over the same 2-week period. These two are typically inversely correlated, so it will be interesting if this aberration persists. Despite the fall in gold last week, we continue to see the miners supported, with the HUI/Gold ratio holding its ground.
Technicals:
- Support: $1,185.75
- Resistance: $1,200
- 50 day moving average: $1,192.59
- 200 day moving average: $1,228.35
- HUI/Gold Ratio: 0.147 (Last week 0.147)
Silver
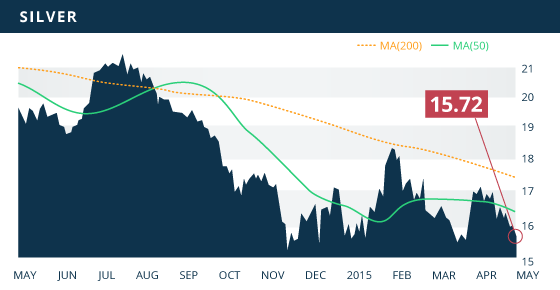
The picture continues to look bleak for silver as support remains weak. The metal was down 4% on the week to close at $15.72. The strength of the dollar has been a heavy weight on the metal, but also, weaker industrial demand for the metal has contributed to the declines. Solid support is at the March 11th low of $15.27, although look for near-term support around $15.38 along a broken trend line ascending from the November low.
There is a solid 2-year declining trend line that the metal continues to obey, and which provides significant resistance below the $17 level. Until this trend line is broken the metal remains in a strong down trend. Near term resistance is at the $16.50 area, which is reinforced by the 100 day MA. The $16.30 level presents an additional hurdle, coinciding with both the 100 and 200 bar MA on the 4-hour chart.
An encouraging sign for the miners is the XAU/Gold ratio increasing for the third consecutive week and up 4.9% during that period, despite silver and gold dropping 7.4% and 1.5% respectively. Whether this support for the miners remains in the face of declining metal prices is an area to watch closely over the next few weeks.
Technicals:
- Support: $15.27
- Resistance: $16.50
- 50 day moving average: $16.32
- 200 day moving average: $17.43
- Gold/Silver Ratio: 75.06
- XAU/Gold Ratio: 0.0593 (Last Week: 0.0589)
Platinum
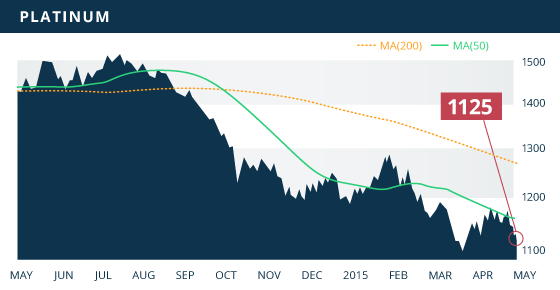
The $1136 level was broken this week, signalling the recent rally has lost its momentum, and may in fact have merely been a dead-cat-bounce of the collapse from the July highs. The performance last week indicates that the 9-month down-trend is still the dominant trend. Short-term support is at the $1123 level, which if breached, will have the metal looking for solid support at the March lows in the $1086 area. Short-term resistance is in place at the $1151 level, a retracement mark reinforced by the declining 50 day MA.
Technicals:
- Support: $1,113.40
- Resistance: $1,151.75
- 50 day moving average: $1,153.91
- 200 day moving average: $1,269.49

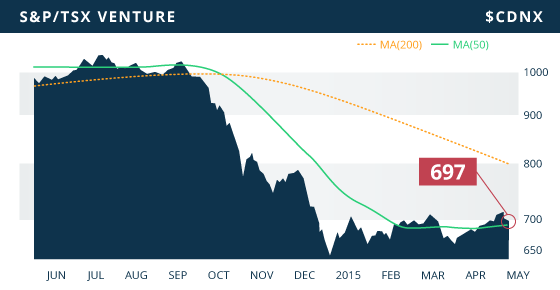
The TSX was up slightly on the week, yet it was the U.S. equities that deservingly grabbed headlines. The NASDAQ broke above its March 2000 high of the dotcom period, and closed at an all time high of 5092.08 on Friday. The S&P500 also continued its ascension and closed in record territory. Meanwhile, the TSX VENTURE fell back below 700 at it shed 5 points on the week.
The declines in the VENTURE were minimized thanks in part to a 3.6% gain by the mining sector. These gains were a result of the Base Metal sector gaining 4.5%, helped by an increase in the copper price to $2.75 a pound as well as a jump in the nickel price to a four-week high. Also contributing was the iron ore sector, which was up a staggering 13% last week while it continued to bounce off multi-year lows. The only trouble for the VENTURE came from gold and energy: the gold sector dropped 1.9% and the energy sector shed 0.3% on the week.
A Look Ahead
As we keep an eye on economies around the world, particularly on the recovery of the US, the condition of the Euro Area, and the growth in China, the key economic items on the calendar this upcoming week are:
Monday April 27
- Services PMI April Flash (US) – Consensus: 59.5
Tuesday April 28
- CB Consumer Confidence (US) – Consensus: 102.5
Wednesday April 29
- Preliminary GDP QoQ (US) – Consensus: 1.0%
- Pending Home Sales MoM (US) – Consensus: 1.2%
- FOMC Statement (US)
Thursday April 30
- BoJ Press Conference
- Preliminary CPI YoY (EA) – Consensus: (-0.1%)
- Initial Jobless Claims (US) – Consensus: 297K
- Personal Spending MoM (US) – Consensus: 0.5%
- GDP YoY (CAN) – Consensus: (-0.1%)
Friday May 1
- Manufacturing PMI (CHN) – Consensus: 50.0
- ISM Manufacturing PMI (US) – Consensus: 51.0
- MI Consumer Sentiment (US) – Consensus: 96.0
We have a busy week ahead, and we are likely to see some volatility in the markets with the sensitive economic events on deck. Short-term traders should be especially on guard on Wednesday and Thursday. The always influential FOMC meeting this week will be very important, considering the degree of weakness in US data since the committee last met in March, as well as the weakness throughout Q1 in general. This meeting does not have a planned press conference afterward, so the market will be heavily scrutinizing the statement for any adjustment in the language. Following a strong Q4, Fed members were confident of a 2015 rate-hike, although with the all around weak data in the first quarter, that confidence is beginning to resemble “hope”.
The market has drastically cut their U.S. Q1 GDP forecast over the past couple of months, and in turn lowering the consensus estimate to 1% growth. The preliminary GDP numbers will certainly be supportive of gold if they come in under 1%.
During the Asian trading session early Thursday morning, the Bank of Japan will be holding a press conference. The market will be looking for some long-term policy forecasts, and it is even possible that we may see some further easing from the BoJ. This is something to keep in mind, as more easing in Japan will continue to strengthen the U.S. dollar and inversely weigh on gold.
Last Week: Last week we saw general weakness with U.S. economic data, especially in the disappointing Durable Goods Orders. This has been an extremely weak area of the economy, with 7 consecutive months of negative readings. The housing numbers were mixed, with Existing Home Sales surging 6.1%, while in stark contrast, New Home Sales fell 11.4% month over month.

We are nearing completion of the Quebec Developers update which we hope to heave out this week. It is a large group of 29 companies with 12 new companies added to the group for this update. This week we will also be finalizing our Top 10 selections for our Spring report, which we anticipate to have out in May.


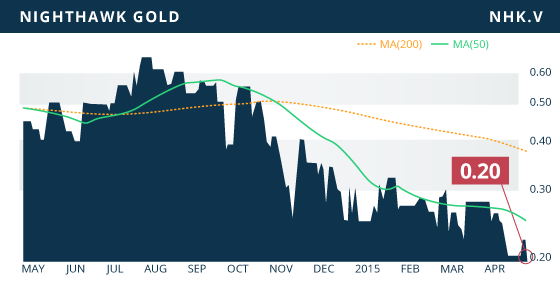
- Symbol: NHL.V
- Price: $0.20
- Shares Outstanding: 58,453,693
- Market Cap: $11.7 Million
- Treasury: $2.5 million (as of January 31st)
- Significant Shareholders: Northfield Capital Corp. (15.6%), Dundee Corp. (13.4%), Osisko Gold Royalties (9.9%), Management and Board (3.7%)
Nighthawk Gold Corp. (TSX VENTURE:NHK.V) is a Canadian-based junior exploration and development company focused on their 100%-owned Indin Lake Project in the Northwest Territories (NWT) of northern Canada. The large 930 km2 Indin property, a historical gold camp with over 14 million ounces of gold production, is located 220 km north of Yellowknife, the capital city of the NWT. The company has a respectable management team, including Michael Byron, former VP of exploration at Lake Shore Gold and Aurora Platinum. Another strong figure on the team is Luc Lessard who was Senior VP and COO of Osisko Mining prior to its acquisition by Agnico Eagle/Yamana. Mr. Lessard, who was also VP of Engineering and Construction with IAMGOLD, has an impressive background that will be invaluable to a company at Nighthawk’s stage.
The Indin Project is hosted within an Achaean greenstone belt, a geological setting similar to those of the prolific Abitibi and Red Lake gold camps. These belts have the potential to contain considerable amounts of high-grade gold, and so the 90% of the Indin Lake greenstone belt incorporated into Nighthawk’s property provided the company with considerable abundant exploration potential. This Project area includes more than 20 known gold deposits and showings, including three past producing mines. The Project contains a large inferred resource of 39.8 million tonnes at and average gold grade of 1.64 g/t for 2.1 million ounces of gold. The 13,647 meters drilled in 2014, coupled with the 59 historical holes re-assayed in 2014, should support an increase in the size of the resource, as well as upgrade a portion of the inferred ounces into the measured and/or indicated (M&I) category. This is especially evident with one of the final holes drilled in 2014, C14-06, intercepting 52.2 metres of 7.78 g/t of gold starting at 196.5 meters below surface.
Although the company has yet to provide guidance on the timing of a resource estimate, we believe it is possible that is may come by mid-year, considering the additional information collected over the past two years. The company has also been quiet about a possible maiden PEA, although metallurgical studies would likely need to be completed first, or in conjunction with the study. Approximately 70% of the resource is contained within 300 meters of surface, and the maximum extent of the wireframe resource is within 500 meters of surface. This deposit setting is amenable to open-pit extraction, which should generate a low-cost scenario that could prove to be economically robust, especially given the 1.64 g/t average gold grade of the resource.
Bottom line
The share price has declined over the past few months as there has been no new news or guidance out since the company released the final 9 holes of their 2014 drill program back in December. As a result, there is no near-term catalyst on the horizon to attract investors. However, we feel that at $0.20, this presents a good opportunity to pick up the company at reasonable prices in preparation for the 2015 exploration season and continued development of the project. The company has sufficient cash in the bank to fund their exploration efforts through 2015, and likely wont need to raise money until early 2016.
One blemish on the company is the consolidation of their shares on a one for five basis back in May of last year. We typically shy away from companies that roll back their shares, however, we think the company is worth having a look at considering the potential contained within the Indin land package, and the experience of the management team.
Potential Catalysts and Events to Monitor:
- 2015 Drill Program (2015)
- Metallurgical Tests (2015?)
- Maiden PEA (2015?)
APR


