
Gold
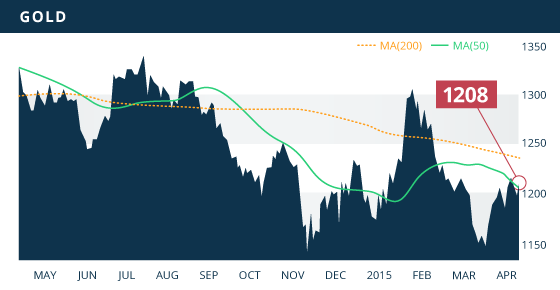
Gold started last week by gapping up after not trading during Good Friday when the NFP numbers were released. The metal pushed to $1224.15 before retreating back below $1200 with the help of the released FOMC minutes from the March meeting. However, gold rallied $15 on Friday to push the price back above $1200 to close last week’s session up $5.60 at $1208.10 an ounce.
The metal needs to hurdle the 100 day MA as it has been largely contained beneath this trend line since mid-February. A break above would have the metal looking to retest the $1224 area and perhaps upwards towards the $1236 level. It is here where the is considerable resistance. At the $1224-$1229 area we have a 50% retracement mark of the January high to the March low, as well as a declining 200 day MA trend line. The metal will need a significant push to get beyond this area. Supporting the price near-term is an ascending trend line from the low of March 19th, which was tested on multiple days since then and it has held up nicely. At this point, there is no clear short-term trend, although the metal has been holding up well amidst a strengthening U.S. dollar.
Technicals:
- Support: $1,199.04
- Resistance: $1,228.50
- 50 day moving average: $1,204.27
- 200 day moving average: $1,234.72
- HUI/Gold Ratio: 0.142 (Last week 0.139)
Silver
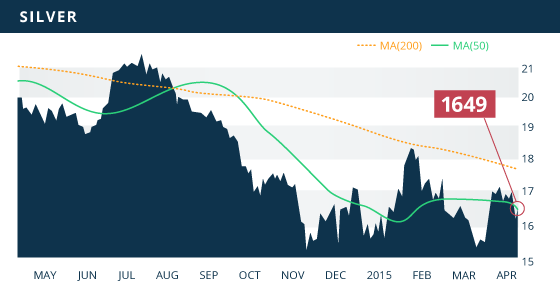
Silver declined for the second consecutive week to close the weekly session at $16.49, down 1.6%. There is significant resistance building for silver, with the $16.89 level once again providing near-term resistance. This area coincides with the 50% retracement from the January high to the March low. If it is able to break through above $17, it will once again encounter stiff resistance around the $17.30 area. Like gold, silver will need a certain catalyst to plough through these resistance marks conglomerating at these levels. One of the most significant of these being the 200 day MA (currently at $17.69), which the metal bounced off of in January and has not closed above since August 1st. There is also a two-year declining trend line that the metal has failed to break through on three separate occasions (July 2014, Jan 2015, and March 2015). This trend line currently sits around $17.15, but again it is declining and continues to supply overhead resistance.
The silver price is starting to get very congested on the upside. There is little technical support for the metal at these levels, and besides some near-term support at the $15.80 area, solid support remains at the March low of $15.27.
Technicals:
- Support: $15.80
- Resistance: $16.89
- 50 day moving average: $16.49
- 200 day moving average: $17.69
- Gold/Silver Ratio: 73.26
- XAU/Gold Ratio: 0.0573 (Last Week: 0.0565)
Platinum
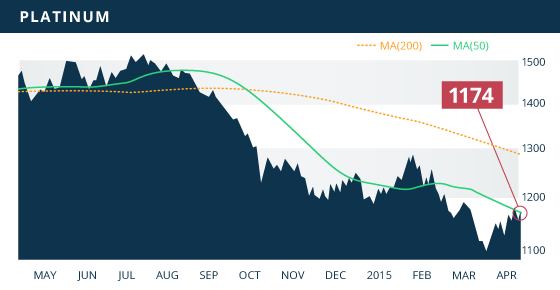
Platinum has been performing well since putting in a multi-year low last month, and is up 8% since that mid-March low. The metal closed up for the fourth week in a row, up 1.7% and closing the weekly session at $1174.40. There is near-term support at the $1148 area, with addition levels of support at the $1,136 level and finally at $1,115. Resistance comes in around last weeks high of $1186 which also coincides with a 50% retracement of the January high to the March low. This should provide a solid cap on the current bounce.
Technicals:
- Support: $1,148.60
- Resistance: $1,186.75
- 50 day moving average: $1,169.44
- 200 day moving average: $1,286.75

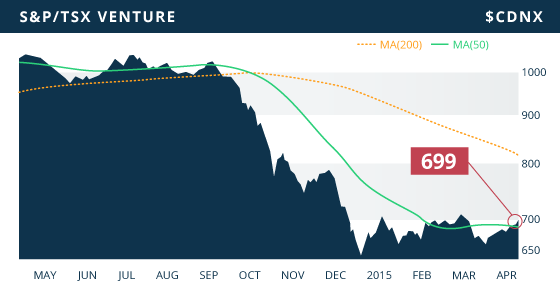
Global stock markets were higher this past week, including the TSX and the TSX VENTURE, which were both up 2.4% and 2.3% respectively. This was largely a result of bargain hutting in the energy space, in turn pushing the sector up 3.2% on the week. The VENTURE closed at a 5-week high of 698.85, while the mining sector was up 1.2% on the week, including the gold sector gaining 2.3% and base metals gaining just shy of 1%.
A Look Ahead
As we keep an eye on economies around the world, particularly on the recovery of the US, the condition of the Euro Area, and the growth in China, the key economic items on the calendar this upcoming week are:
Monday April 13
- Balance of Trade (CHN) – Consensus: $45.35B
Tuesday April 14
- Core PPI MoM (US) – Consensus: 0.3%
- Retail Sales MoM (US) – Consensus: 1.1%
Wednesday April 15
- GDP Growth QoQ, YoY (CHN) – Consensus: 1.4%, 7%
- Industrial Production YoY (CHN) – Consensus: 6.9%
- Industrial Production MoM (US) – Consensus: -0.3%
- BoC Interest Rate Decision (CAN) – Consensus: 0.75%
Thursday April 16
- Initial Jobless Claims (US) – Consensus: 280K
- Housing Starts (US) – Consensus: 1040K
- Building Permits (US) – Consensus: 1080K
Friday April 17
- Inflation Rate MoM, YoY (EA) – Consensus: 1.1%, (-0.1%)
- Inflation Rate MoM, YoY (CAN) – Consensus 0.5%, 1.0%
- Inflation Rate MoM, YoY (US) – Consensus: 0.2%, 0.0%
- MI Consumer Sentiment Prel. (US) – Consensus: 94
The market will be monitoring the PPI and CPI numbers out of the U.S. to asses the state of inflation within the country. The market will also be assessing the CPI numbers out of the EA and Canada as well. The market will be looking for better numbers from U.S. housing starts, after the dismal numbers in February. The initial jobless claims will continue to be monitored following the poor NFP numbers a couple of weeks back. Investors will be looking for the number to remain below 300k for the 6th week in a row. Once again there is plenty of commentary from Fed members scheduled this week. Their commentary last week helped the U.S. dollar correct and regain its momentum upward.
Last Week: The main driver out last week was the FOMC minutes from the March meeting. The minutes instantly reminded the market of the committee’s sentiment towards the U.S. economy and the prospect of a near-term rate-hike. These minutes also had the market quickly shrugging off the disappointing NFP numbers from the prior week.

Ontario Developers is complete and will be released early in the week. We are currently working through Quebec Developers which we will have updated shortly after. We continue to narrow down our shortlist for the Top 10 Spring Report, which we anticipate to have complete by early May.
Top 10 Updates:
Galane Gold (GG.V) released their Q4 and Year-End financial results, which showed the company earning $1.87 million (U.S.) in 2014 with a closing cash balance of $9.7 million (U.S.). The shares continue to trade at a discount to Galane’s cash position.
Kootenay Silver (KTN.V) announced initial 6 holes from their phase II drill program at La Negra. All 6 holes intercepted significant lengths of silver mineralization including hole LN-31-15 which intercepted 180 meters from surface grading 66.12 g/t. Kootenay continues to successfully build out this resource with every hole.


- Symbol: GNC.V
- Price: $0.22
- Shares Outstanding: 43,797,954
- Market Cap: $9.6 Million
- Cash: $2.7 million
- Significant Shareholders: Van Eck Global (12.5%), Wellington Management (11.9%), Tocqueville (4%)
Note: Gainey Capital is not currently covered in the Tickerscores database.
Gainey Capital Corp. (TSX VENTURE:GNC) (OTCQX:GNYPF) is a junior exploration company exploring its 100%-owned El Colomo Project in the state of Nayarit in western Mexico. The 19,274 hectare El Colomo Project contains a historic resource but also possesses considerable upside exploration potential. However, what separates Gainey from the rest of the junior explorers is that the company also possesses a 300 tpd mill that the company is currently using for toll milling. This toll mill operation is generating cash flow which will continue to help fund exploration on the El Colomo property. This is an extremely advantageous scenario to have at a time when financing in the junior resource sector is difficult to come by.
El Colomo was first discovered by Asarco in 1993, with the company drilling a total of 16 holes on the property. 7 holes were drilled to test the La Nueva Victoria vein, with the first hole (C-1) intercepting 7.5 meters grading 13.64 g/t of gold and 899 g/t of silver. However, the following 6 holes were not as impressive, especially the last 4 holes. The company will focus their trenching and drilling efforts in 2015 to confirm, as well as expand on, this historic resource. The property geology of El Colomo is characterized by low-sulphidation epithermal veins, with the most prominent of these being the La Nueva Victoria vein. The La Nueva Victoria vein has a historic (non-43-101 compliant) resource of 442,000 tonnes grading 13.75 g/t Au-Eq, containing close to 100,000 gold ounces and 5 million silver ounces. Furthermore, the La Higuerita zone, a lower grade bulk-tonnage prospect, has a historic resource of 20 million tonnes at 1.37 g/t Au-Eq for 881,000 Au-Eq ounces.
The exploration team is led by geologist Peter Megaw, who is a Mexican expert with discoveries such as MAG Silver’s Juanicipio deposit to his credit. Gainey also brought aboard some ex-Barrick talent in George Cantua to act as operations manager. He was operations supervisor at the 20,000 tpd Pueblo Viejo gold mine in the Dominican Republic, and will operate and optimize the 300 tpd facility at El Colomo. The mill is also fully permitted, including infrastructure in place, to expand to 600 t/d.
The 2015 exploration program will consist of stream sampling, followed by geological mapping and geochemical sampling. The company will then conduct a trenching program aimed at testing the most prospective areas displayed by the earlier sampling efforts. After compiling the data from the trenching program as well as the geochemical sampling, the company will identify drill targets and test these targets with up to 5000 meters of drilling later in the year. The company recently announced the initial results of the stream sediment sampling and rock chip sampling program. In addition to the strongly anomalous results of these samples, the exploration team also discovered a new high-grade vein structure 700 meters north, and on strike, of known mineralization.
The company has multiple tolling agreements in place, which will keep the mill busy going forward. However, Gainey also plans on processing ore from their 100% owned El Colomo property as part of a bulk sample. This will provide the company with both geological knowledge as well as addition revenue on a 100% basis.
Bottom line
It is rare that a junior explorer is able to subsidize their exploration efforts through cash flow generated from internal operations. We believe the toll milling operations in Mexico will not only provide the company with revenue to help fund exploration efforts at El Colomo, but will also provide a solid platform to build the company around. The mitigation of share dilutive financings as a result of the revenues generated by the milling is a very attractive component of this company.
Potential Catalysts and Events to Monitor:
- El Colomo Exploration: Geochemical Sampling and Trenching (H1 2015)
- El Colomo Drilling (H2 2015)
- Toll-Milling Revenue (2015)

APR


