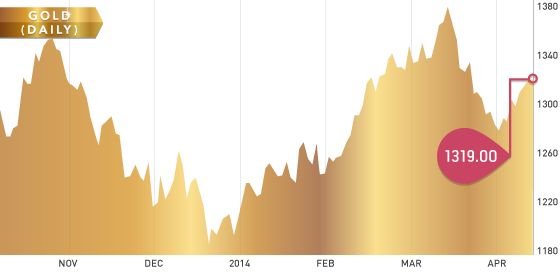
It was another relatively quiet week for the gold, which closed at $1,318.40 per ounce from last week’s close at $1,303.50. It’s interesting to see gold close near a three-week high while the U.S. dollar index is near a three-week low. Gold traders always need to pay attention to the U.S. dollar, as historically, gold tends to trade inversely to the direction of the USD. The tension between Russia and Ukraine continues and if it boils over you may see some safe haven buying come into gold. One other item to keep an eye on is the selloff in the markets, as people tend to move to safe haven assets when this occurs.
Silver continues to trade in the $19-$22 range this year and closed at $19.98 per ounce.
Gold continues to outperform silver this year by quite a wide margin. Gold year to date is up 9.31% while silver is up 2.23%.
Gold Chart
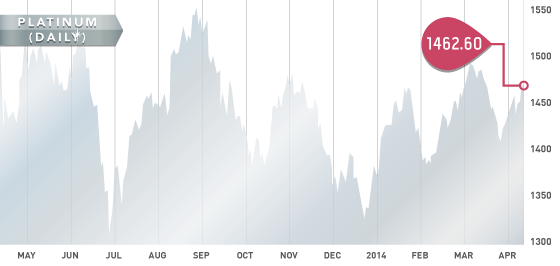
Platinum finished the week at $1,462.50 per ounce as the strikes in South Africa continue. It appears no end is in sight as the mines and workers continue to be not even close to an agreement. As the strike moves on we expect to see platinum prices respond as stockpiles decline. As of Friday, platinum companies have now lost more than 12.5 billion Rand in revenue while employees have lost 5.5 billion Rand in earnings.
Of note is that palladium broke through $800 on Friday to reach a two-and-a-half year high. The world’s largest producer of palladium is Russia and concerns over supply are increasing. Palladium ETF’s have also attracted 270,000 ounces in the past couple weeks.
Platinum Chart
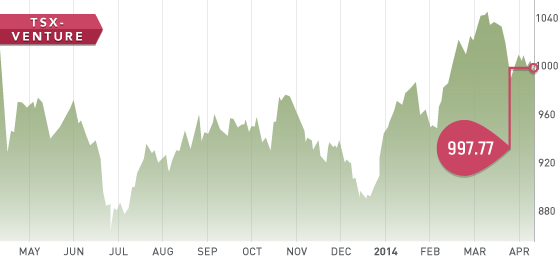
The TSX Venture opened the week at 1007.16 and closed at 997.77. We again remind investors of the typical “sell in May and go away” period. It is not a bad idea to have some cash available for the summer as we expect to see some great deals come up. All audited financials are due by the end of April for every company that use December as year-end.
More and more marijuana stocks are popping up on the TSX Venture and the CSE. The bigger the bubble gets the faster it will pop. Most of these companies have little in the way of fundamentals behind them. They are helping the volume on both exchanges though.
TSX-V Chart
A Look Ahead
The key items on the calendar next week are:
• Monday April 14th – US Retail Sales
• Tuesday April 15th – Consumer Price Index
• Wednesday April 16th – Housing starts
• Thursday April 17th – Unemployment claims
Africa gold producers are almost complete. Look for this in your inbox sometime next week.
Analyst portfolio performance: Year to date performance is still very strong at 22.57%. The top 5 are up 33.08%.
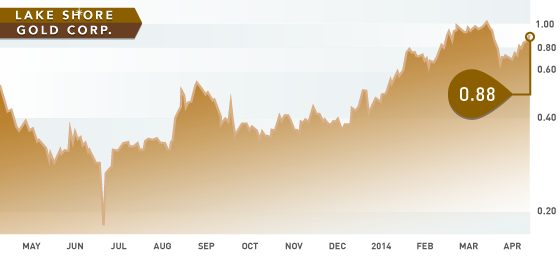
 Symbol: LSG.T
Price: $0.88
Shares Outstanding: 416,620,224
Market Cap: $349,961,000
Cash: $41 million
Lake Shore Gold is a gold producer in Ontario. The company is a turnaround story and looks to be finally delivering for investors after years of underperformance. Lakeshore had a successful 2013 with production growth of 57%, a decrease in all-in sustaining cash cost by 52%, and positive free cash flow in the fourth quarter. In 2014, production is expected to be between 160,000 – 180,000 ounces with an all-in sustaining cash cost of $950-1050 per ounce. First quarter 2014 production was above guidance and came in at 44,600 ounces. Free cash flow will be used to pay off debt and build the current cash position of ~$41 million. If you are looking at a gold producer that is making money at the current gold price, Lake Shore Gold is a good bet.
APR


